Monitoring pipelines
Viewing your builds and logs
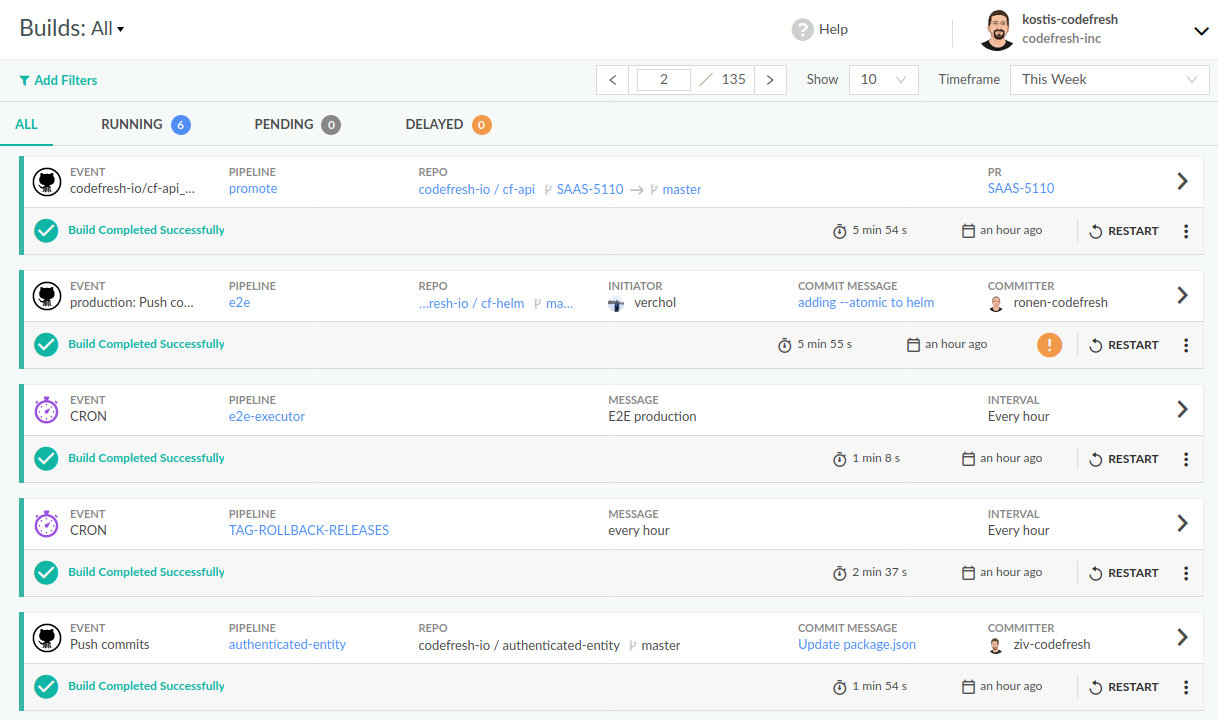
View activity for Codefresh pipelines in the Builds tab.
- Global build view: The default view, displays builds for all pipelines for all projects across your organization.
- Project build view: Selecting a project displays the builds for the pipelines in the project.
As a user, you can see builds from all pipelines you have access to. If your permissions do not include access to specific pipelines, you will not see builds from those pipelines.
The Builds page for a pipeline displays by default all builds sorted from the most recent to the oldest. To narrow the list, you can use the date range filter and additional filters at the top of the page.
In addition, the Pipelines Dashboard serves as a centralized location to track pipelines performance by KPIs.
Concurrency recommendation per Runtime Environment
Concurrency limits control the number of simultaneous builds for Codefresh pipelines. Concurrency limits are set at both the account and specific pipeline levels.
Balancing concurrency and performance
While a single Runtime Environment technically supports concurrent build executions in the hundreds, it is essential to be aware of the actual number of concurrent builds that are initiated at the same point in time.
To prevent potential slowdowns due to extremely large build-bursts, we recommend capping the number of concurrent builds initiated for a Runtime Environment to a maximum of 1000.
Starring projects and pipelines as favorites
Mark frequently used or high-priority pipelines as favorites in the Projects and Pipelines pages. This allows for easy and quick access to important projects or pipelines.
Favorites serve as predefined filters in the Pipelines Dashboard, enabling you to track and analyze their performance.
When you star a project or pipeline as a favorite, the Favorite filter in the Pipelines Dashboard icon changes from ![]() to
to ![]() . Click on it to filter by favorite projects and pipelines.
. Click on it to filter by favorite projects and pipelines.
Viewing status for pipeline builds
Each build’s status is displayed beneath the build details, identifiable by a distinct icon. Refer to the table below for a description of the various statuses associated with pipeline builds.
| Pipeline Build Status Icon | Description |
|---|---|
| Pipeline build is currently running. | |
| Pipeline build completed successfully. | |
| Pipeline build run has been delayed as there are no free builders. A build can be delayed for a maximum of seven days. Each account can have up to a 1000 delayed builds at any time. NOTE:
|
|
| Pipeline build is pending approval. | |
| Pipeline build pending approval has been denied approval. | |
| Pipeline build is gracefully terminating execution. | |
| Pipeline build execution has been manually or automatically terminated. | |
| Pipeline build execution has failed because of errors. |
Applying filters on the build view
The Add Filters option allows you to filter the list of builds by additional criteria, including build status.
At the most basic level, you can filter by status, choosing between Running/Pending/Delayed builds.
You can further filter the builds by choosing the various filter types that specify the build job.
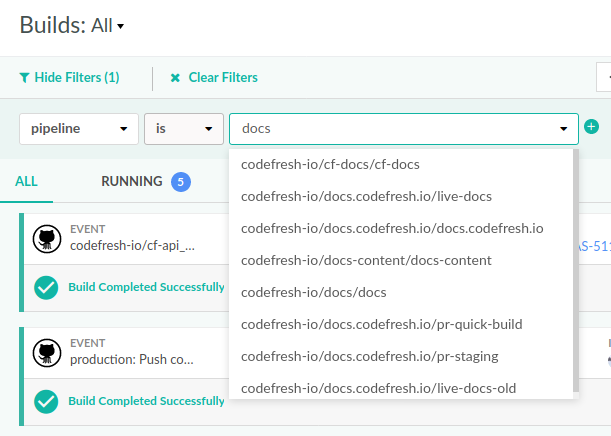
The available filters are:
- Pipeline: Any of the pipelines available.
- BoardId: The name of the Helm board
- Provider : The Git provider.
- Repository: Git repository with the trigger.
- Type: Build (user-initiated), or system (auto-initiated), see launch a test environment.
- Branch: Any of the available branches from the attached Git trigger.
- Committer: The user who made the commit that triggered the build.
- Environment: The environment affected by the build.
- Status: Success, error, in-progress, pending, terminated etc. A Pending status can also indicate that pipeline build execution has been paused for the account.
- Trigger type: The type of trigger that caused the build to run.
- Git event: For Git triggers, the exact event that triggered the build.
- Trigger-name: The name of the trigger that triggered the build.
- Annotations: The build annotations to filter by, defined as key=value pairs. You can filter the same annotation by multiple values.
Notice that all filters are multiple-choice so you can select multiple values for each filter category. At any given point you can see all the active filters at the top of the page the screen.
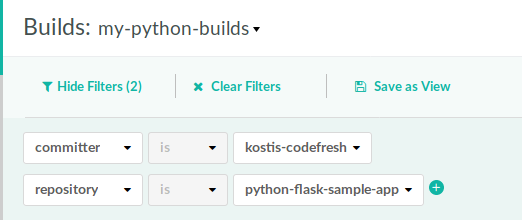
You can easily remove active filters, by clicking on them and adding/removing values.
To the right, you have the date range options:
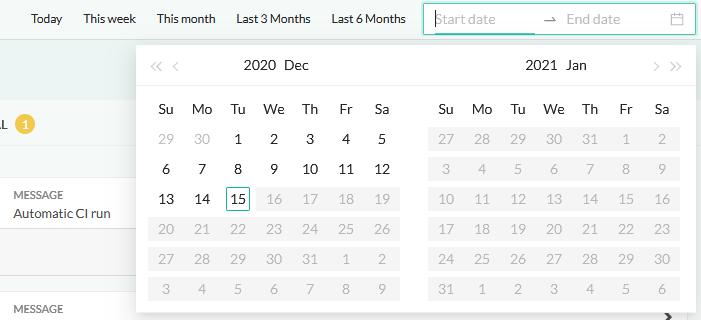
You can combine all previously mentioned filters with the time based filters.
Creating build views
Once you have a set of filters that you use regularly, you can save them as a custom Build View by clicking the Save as View button and providing a name.
Now you can select at the top of the window any of the available build views to automatically filter results according to the respective sets of filters.
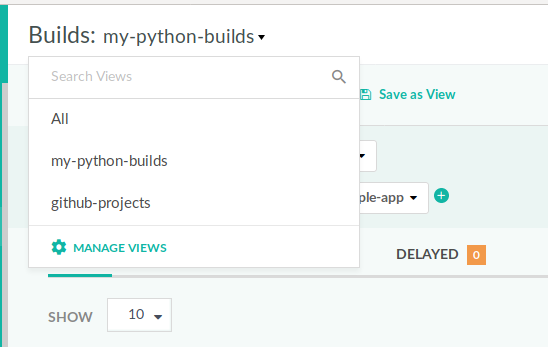
You can delete existing build-views by clicking on the manage views button. You can change the filters of an existing build view by making a new filter selection and then saving the view with an existing name (effectively overwriting it).
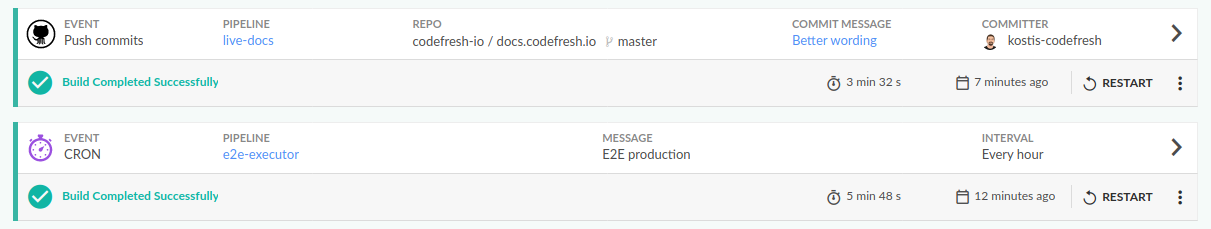
Build details
For each individual build you can see several details such as the git hash, the person who made the commit, the pipeline that was triggered as well as how much time it took. For each event type you will also see additional context related information.
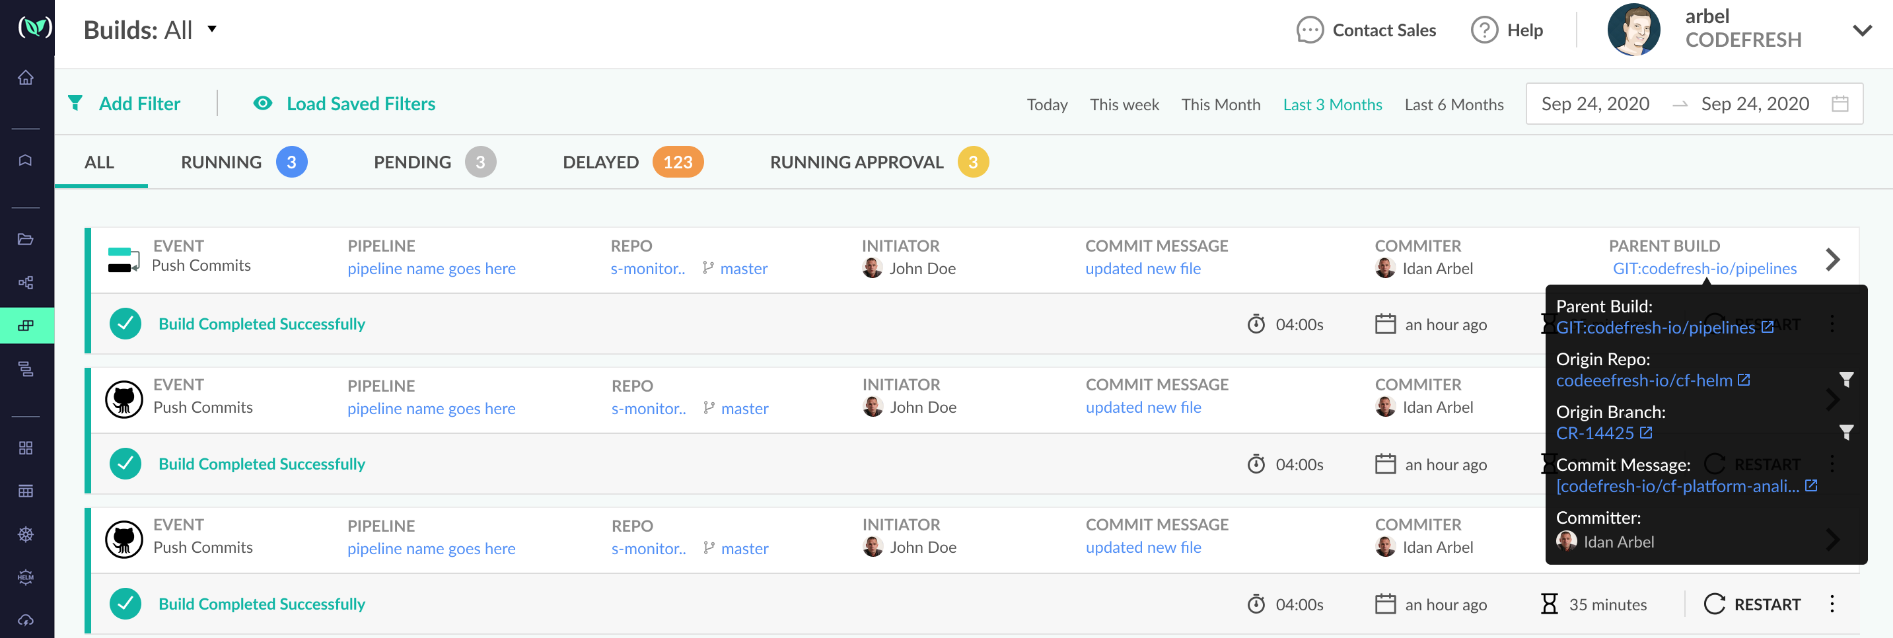
Child builds triggered by other builds are identified in the Event column by the icon ![]() .
.
The Parent Build column shows the link to the parent build. Mouse over to see the tooltip with information on the parent build. The tooltip includes links to the parent build, repo, branch, commit message, and the ability to filter by repo and branch.
There are also extra options if you click the small “3-dot” menu button on the right. For a particular build, you can:
- View the logs
- View the YAML
- View or add annotations
- View the images produced (and consequently launch an on-demand test environment
Notice that if you restart a pipeline it will trigger with the exact settings it originally had. So if this was a manual trigger where you disabled caching or changed the notification options, the new execution will still honor those settings (even if you have changed them for later builds).
An extra button for test reports will be visible if you are using the test report feature of Codefresh.
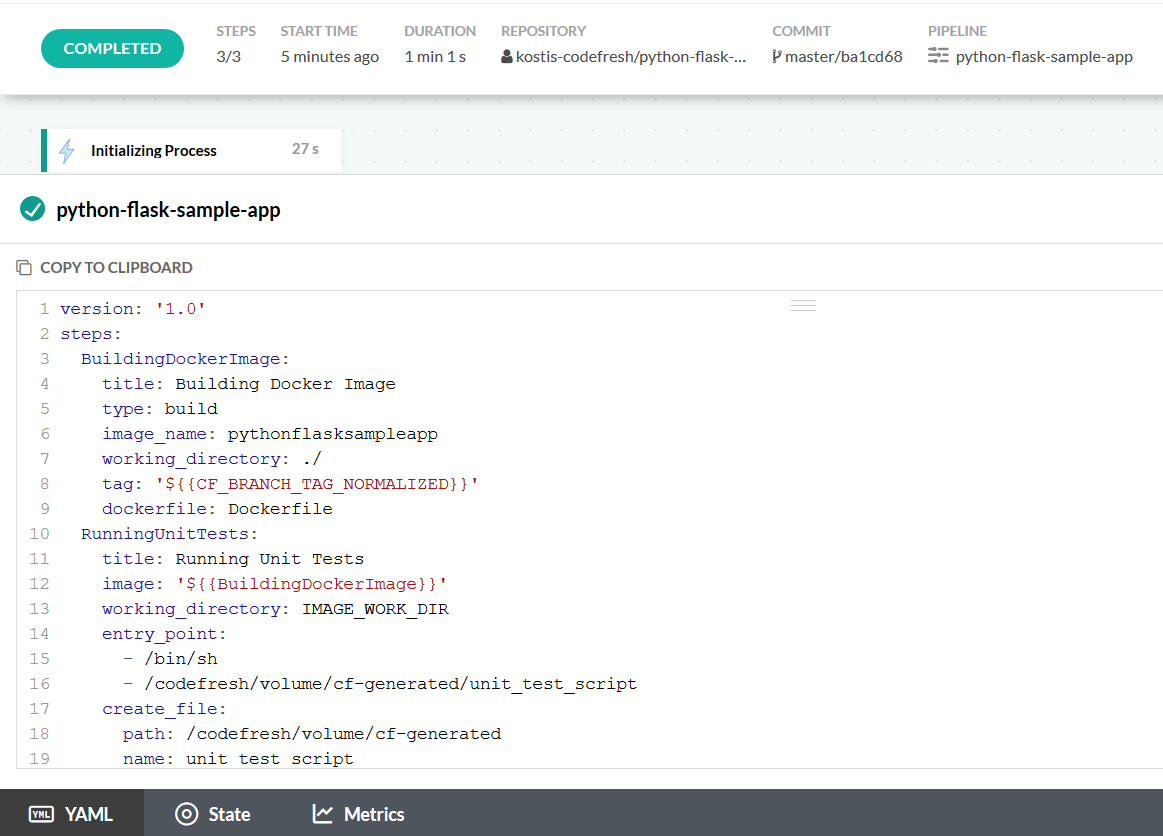
Viewing details for an individual pipeline build
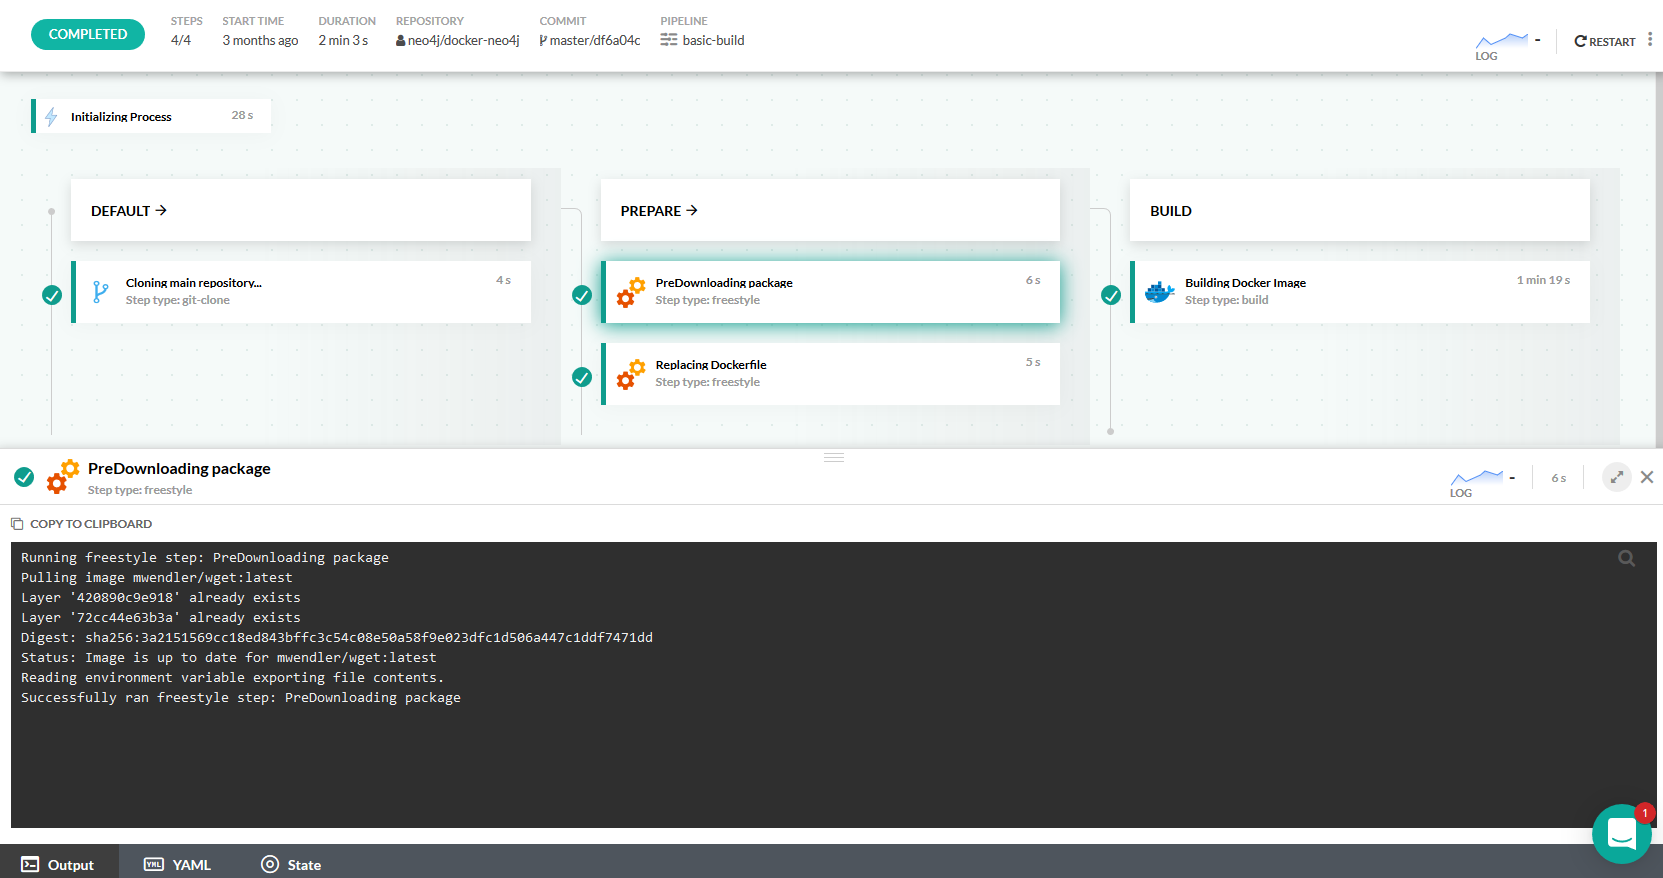
If you click on any individual pipeline build, you will enter the pipeline build information screen. From here you can see more details for a build such as the logs, running time and resource metrics.
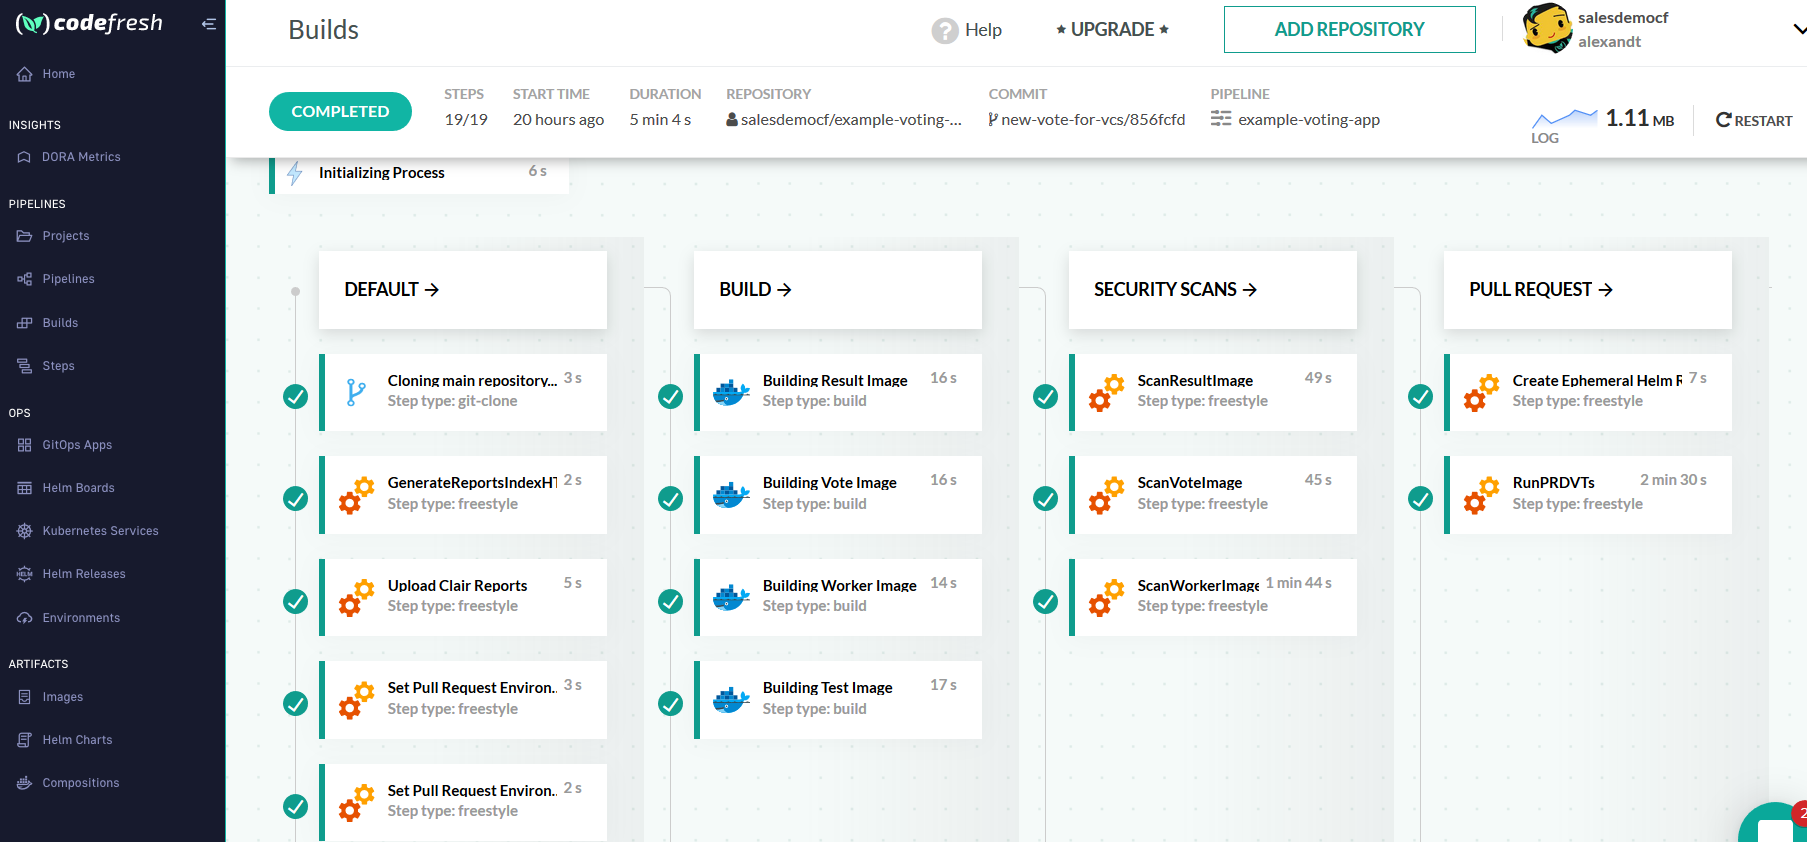
Each section in this screen corresponds to each pipeline step. There are two special steps:
- Initializing Process
- Cloning Main Repository
These are Codefresh built-in steps and will appear for most builds (you can also create a pipeline that doesn’t clone a git repository by default). The rest of the step names depend on your codefresh.yml (or the default step names provided by Codefresh). The different columns take the names from the defined pipeline stages.
Viewing status for pipeline steps
Monitor the status of the steps in the pipeline as they are executed.
| Step Status Icon | Description |
|---|---|
 |
Pipeline step completed successfully. |
 |
Pipeline step pending approval has been approved, either manually or automatically. |
 |
Pipeline step pending approval has been denied approval. |
 |
Pipeline step currently running. |
 |
Pipeline step running in debug mode. See Debugging pipelines for more information. |
 |
Pipeline step gracefully terminating execution. |
 |
Pipeline step execution has been manually or automatically terminated. |
 |
Pipeline step execution has been terminated because of error. |
Viewing/downloading logs for builds and build steps
View logs for running and completed builds and download them in HTML or text formats.
You can view logs online, for the entire build or for single or specific steps in the build. Similarly, you can download the logs for the entire build, or for single or specific steps.
The Filter Logs option is useful to view and manage logs, especially for large builds as there is a max size limit for logs. You can also search logs.
You can also share logs with other users logged in to the same account.
NOTE
The max log size for the entire build is 100MB, and 20MB per step. The system stops generating logs once the build size exceeds the maximum permitted. For large builds, it is easier to filter the logs by single or multiple steps, and then view/download them.
- In the Builds page, select a build.
- To view logs online for the selected build, click Output in the lower part of the Build page.
- Optional. Select Filter Logs and then select the step or steps for which view/download logs.
Logs are displayed for the selected steps. - From either the context menu on the top-right of the toolbar or from the Output pane, select Download as HTML or Download as text.
The log file is downloaded with the build ID as the filename, including also the step name if the log is for a single step, in the format `<build-id-
'.
Sharing log URLs for pipeline builds
Resolve issues in pipeline builds more efficiently and quickly by sharing relevant log segments with your colleagues, either for a specific build step or for the entire build.
Select the part of the log and share the generated URL with members logged in to the same account. The URL opens to the exact location in the build log that you selected.
IMPORTANT
This functionality requires timestamps for build logs which will be enabled for all Codefresh accounts. Enabling timestamps in logs can affect any automation you may have created based on log outputs without timestamps. To opt out of timestamps in logs, please contact Codefresh Support.
This functionality will be available to all customers starting December 14.
NOTE
Users with whom you share the logs must be logged in to the same account.
Before you begin
- Make sure build logs have timestamps
How to
- In the Builds page, select a build.
- Do one of the following:
- To view logs for a specific step, click the step.
- To view logs for the entire build, click Output in the lower part of the Build page.
- Select the lines you want to share.
- Click Share in the top-right corner.

- In the pop-up that appears, click Copy to clipboard.
- Share the URL with users logged in to the same account.
On accessing the link, the browser opens the Builds page, with the shared section highlighted in the build log.

Viewing variables in pipeline builds
Variables, both system (environment) and custom (user-defined), are injected into pipelines from different sources and at different levels.
The variables actually used by a specific build of the pipeline varies according to the events that triggered the pipeline.
Select a build to view all its variables, and identify their source, and overrides if any.
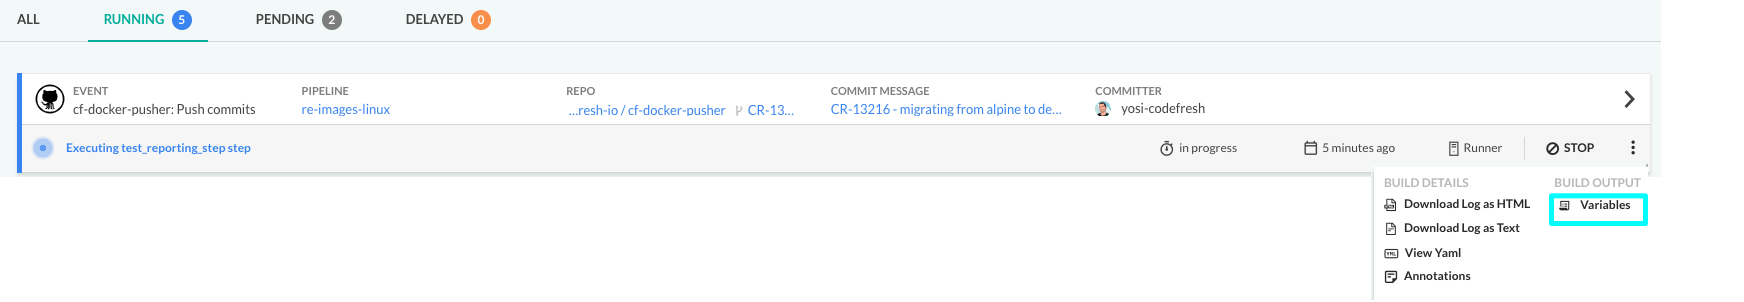
- In the Builds page, either select the build and then open the context-menu, or open the context-menu on the right of the build entry.
- Select Variables.
- If required, click the Sort icon for the group to sort in alphabetical order.
- To copy the group’s variables to the clipboard, click the Copy icon.
Here’s an example of the list of variables for a pipeline build.
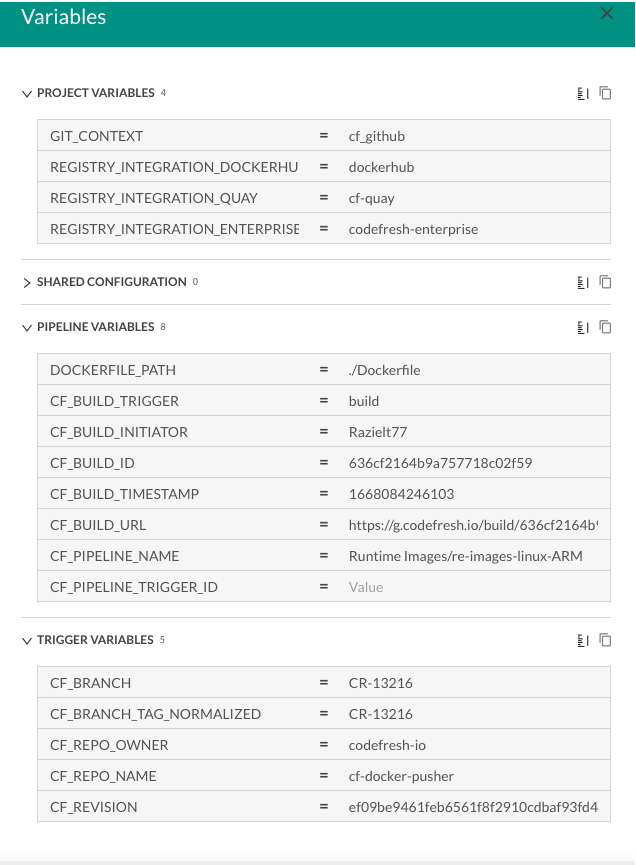
The variables are grouped by granularity, starting with the global project-level variables and ending with the trigger-level variables with the highest granularity:
- Project
- Shared configuration
- Pipeline
- Trigger
A variable with a strikethrough indicates an override by the same variable in a lower-level group. For rules on precedence and overrides for variables in builds, see Variables.
NOTES
- Variables exported across steps with
cf_exportare not identified ascf-exportedvariables in the list.- Secret-type variables are always masked.
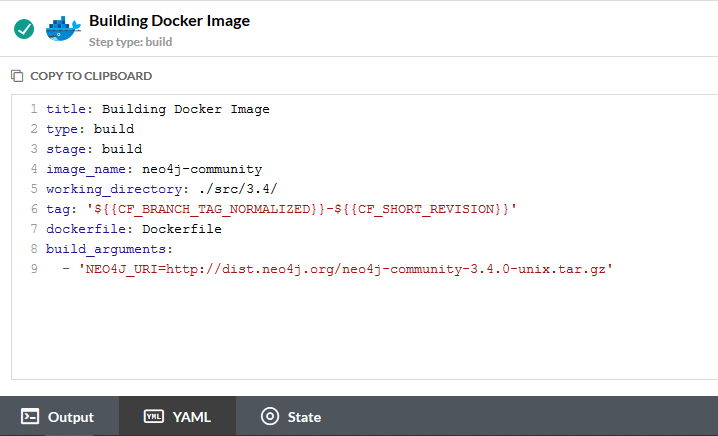
Reviewing the YAML for the pipeline
From the step details you can also click on the yaml tab to see the yaml segment for that individual step:
If you want to see the yaml for the whole pipeline,
- Click the YAML tab on the bottom left corner without selecting a step first or
- Select the three dots next to the “RESTART” button on the top-right, and click on Show YAML
In both cases you can copy to clipboard the yaml shown using the button at the top left corner.
Viewing pipeline metrics
Codefresh offers several metrics for the pipeline, and for steps in the pipeline, that allow you to get a better overview of the resources consumed by your pipeline.
NOTE
When your pipeline includes at least one step that does not use buildx, memory usage is not displayed, both for the build and for individual steps.
For information onbuildx, see Fields in the Build step.
Pipeline metrics
At the most basic level, Codefresh displays quick metrics while the pipeline is running that include memory consumed and size of logs:
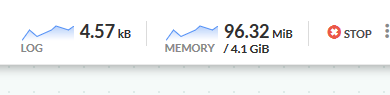
-
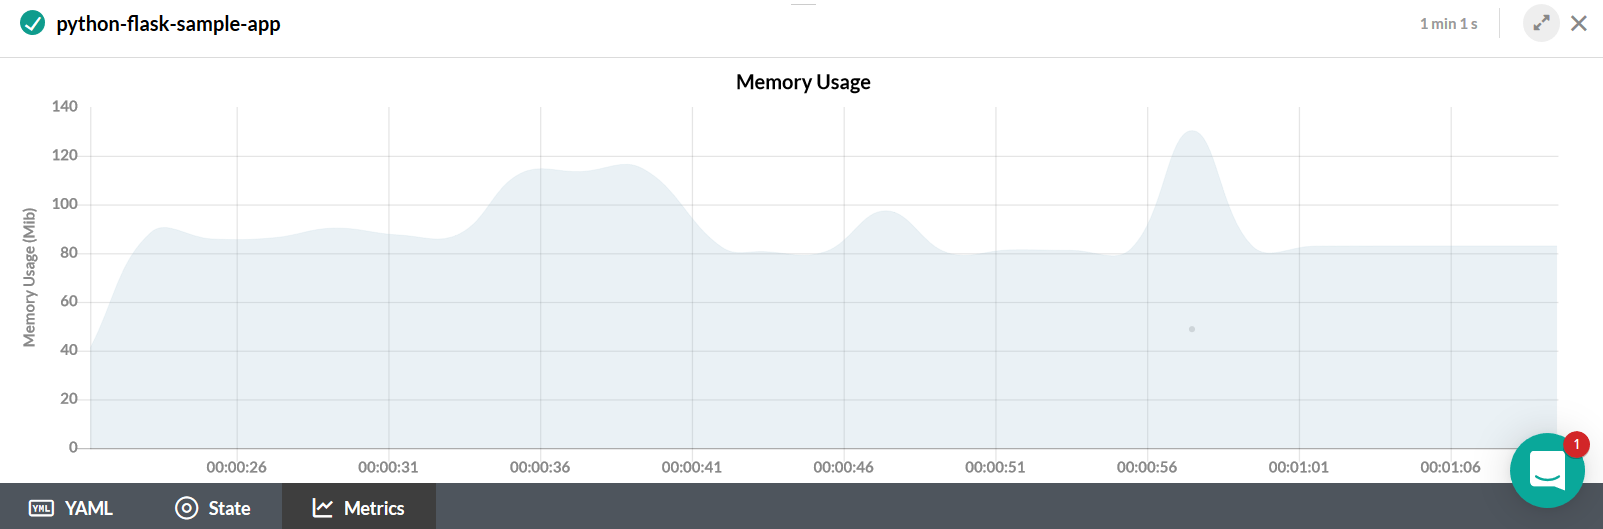
To view memory and disk usage for running or completed pipeline builds, click the Metrics tab at the bottom of the Build page.
- Memory usage: View memory usage (Y-axis) by time (X-axis) for the duration of the build.
- Disk usage: View disk usage (Y-axis) by time (X-axis) for the duration of the build. The red line is set at 90% of the maximum disk space.
To see the precise usage at different points in time, mouse over the dots.
Viewing the actual disk usage for a build during its run allows you to better gauge and define the minimum disk space required for the build volume.
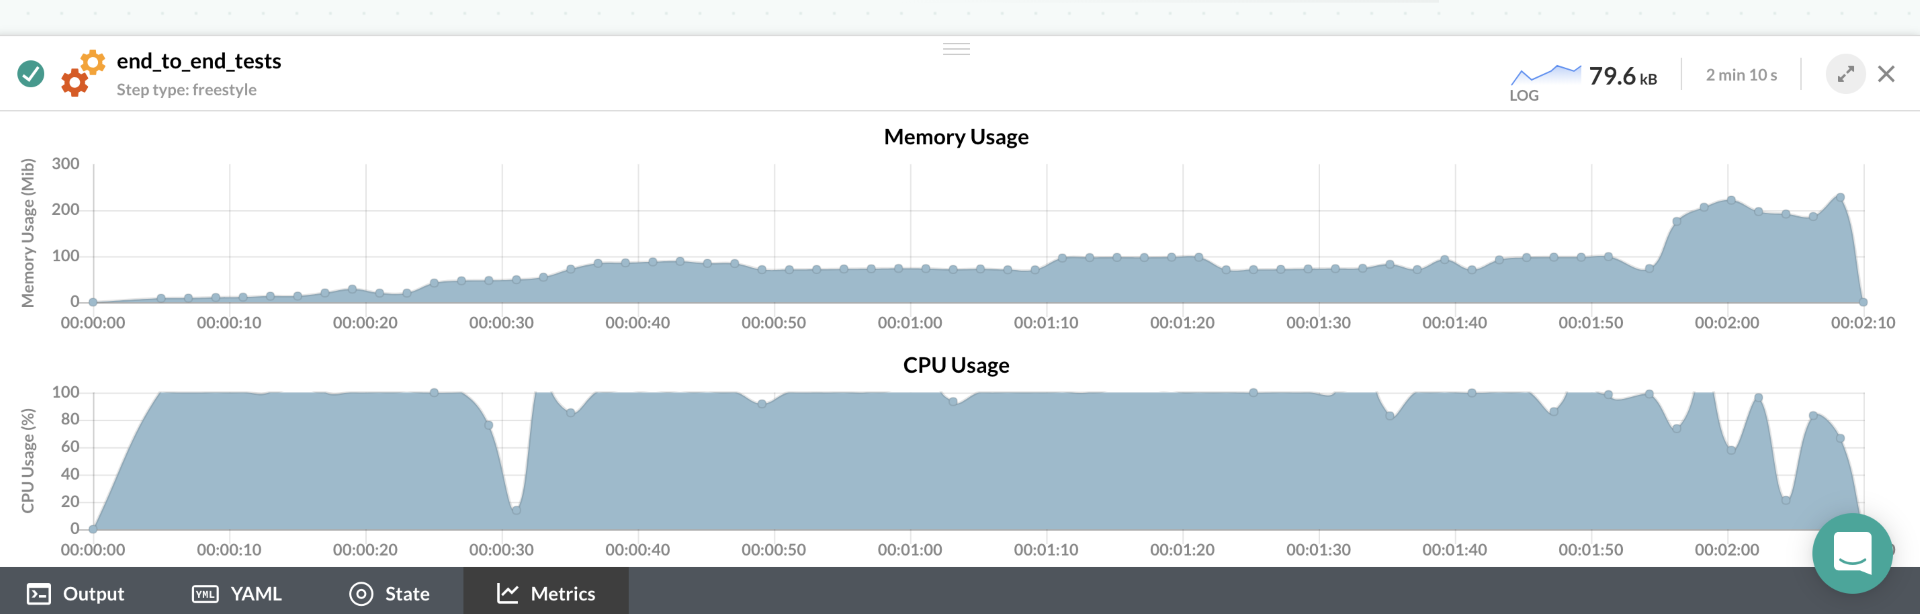
Pipeline-step metrics
For step-specific metrics, first select the step, and then click the Metrics tab. Step metrics are available for memory and CPU usage (not disk space).
Restarting the pipeline
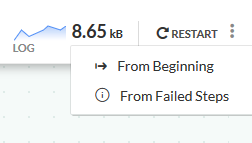
You can restart a failed pipeline either from the beginning or from a failed step.
Restart from beginning
Restarts the pipeline with the same state as in its original execution, including the original Git commit.
TIP
To restart the pipeline with a new state, use the Run button in the pipeline editor, and select any of the available triggers.
Restart from failed step
Restarts the pipeline from the step that failed in the previous execution. Similar to restarting from the beginning, restarting from a failed step also restarts the pipeline with the same state at that point in time, including the original Git commit. You can restart from the Builds page or directly from the specific step that failed.
NOTE
The option to restart from a failed step is available only when Permit restart pipeline from failed step is enabled in the pipeline’s settings. See Restart pipeline option in Policies.
If your pipeline has some flaky steps, you can also use the retry syntax in your YAML instead of restarting them manually each time they fail.
Restart pipeline from Builds view
- In the row with the pipeline to restart, click Restart, and then select the required option.
TIP
Disabled From Failed Steps indicates that the option is not enabled for the pipeline.
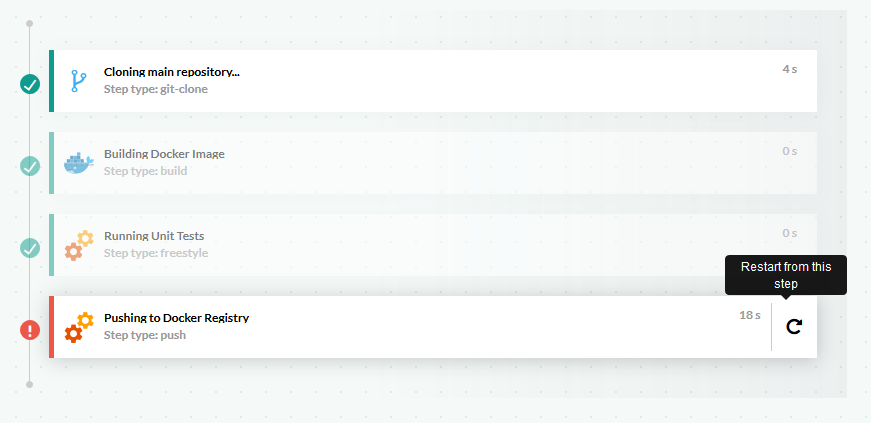
Restart from step view
- Click the pipeline to view its steps.
- Go to the failed step, right-click and then select Restart from this step.
Visualize parent-child relationships for pipeline builds
Select a build for a pipeline and visualize all builds it is linked to at the different levels, including parent, sibling, and child builds in the Build Tree. The Build Tree view displays associated builds within the scope of the selected pipeline build.
- From the sidebar, below Pipelines, select Builds.
- Click the build to go to the step view for the build.
- In the lower part of the page, click Build Tree.
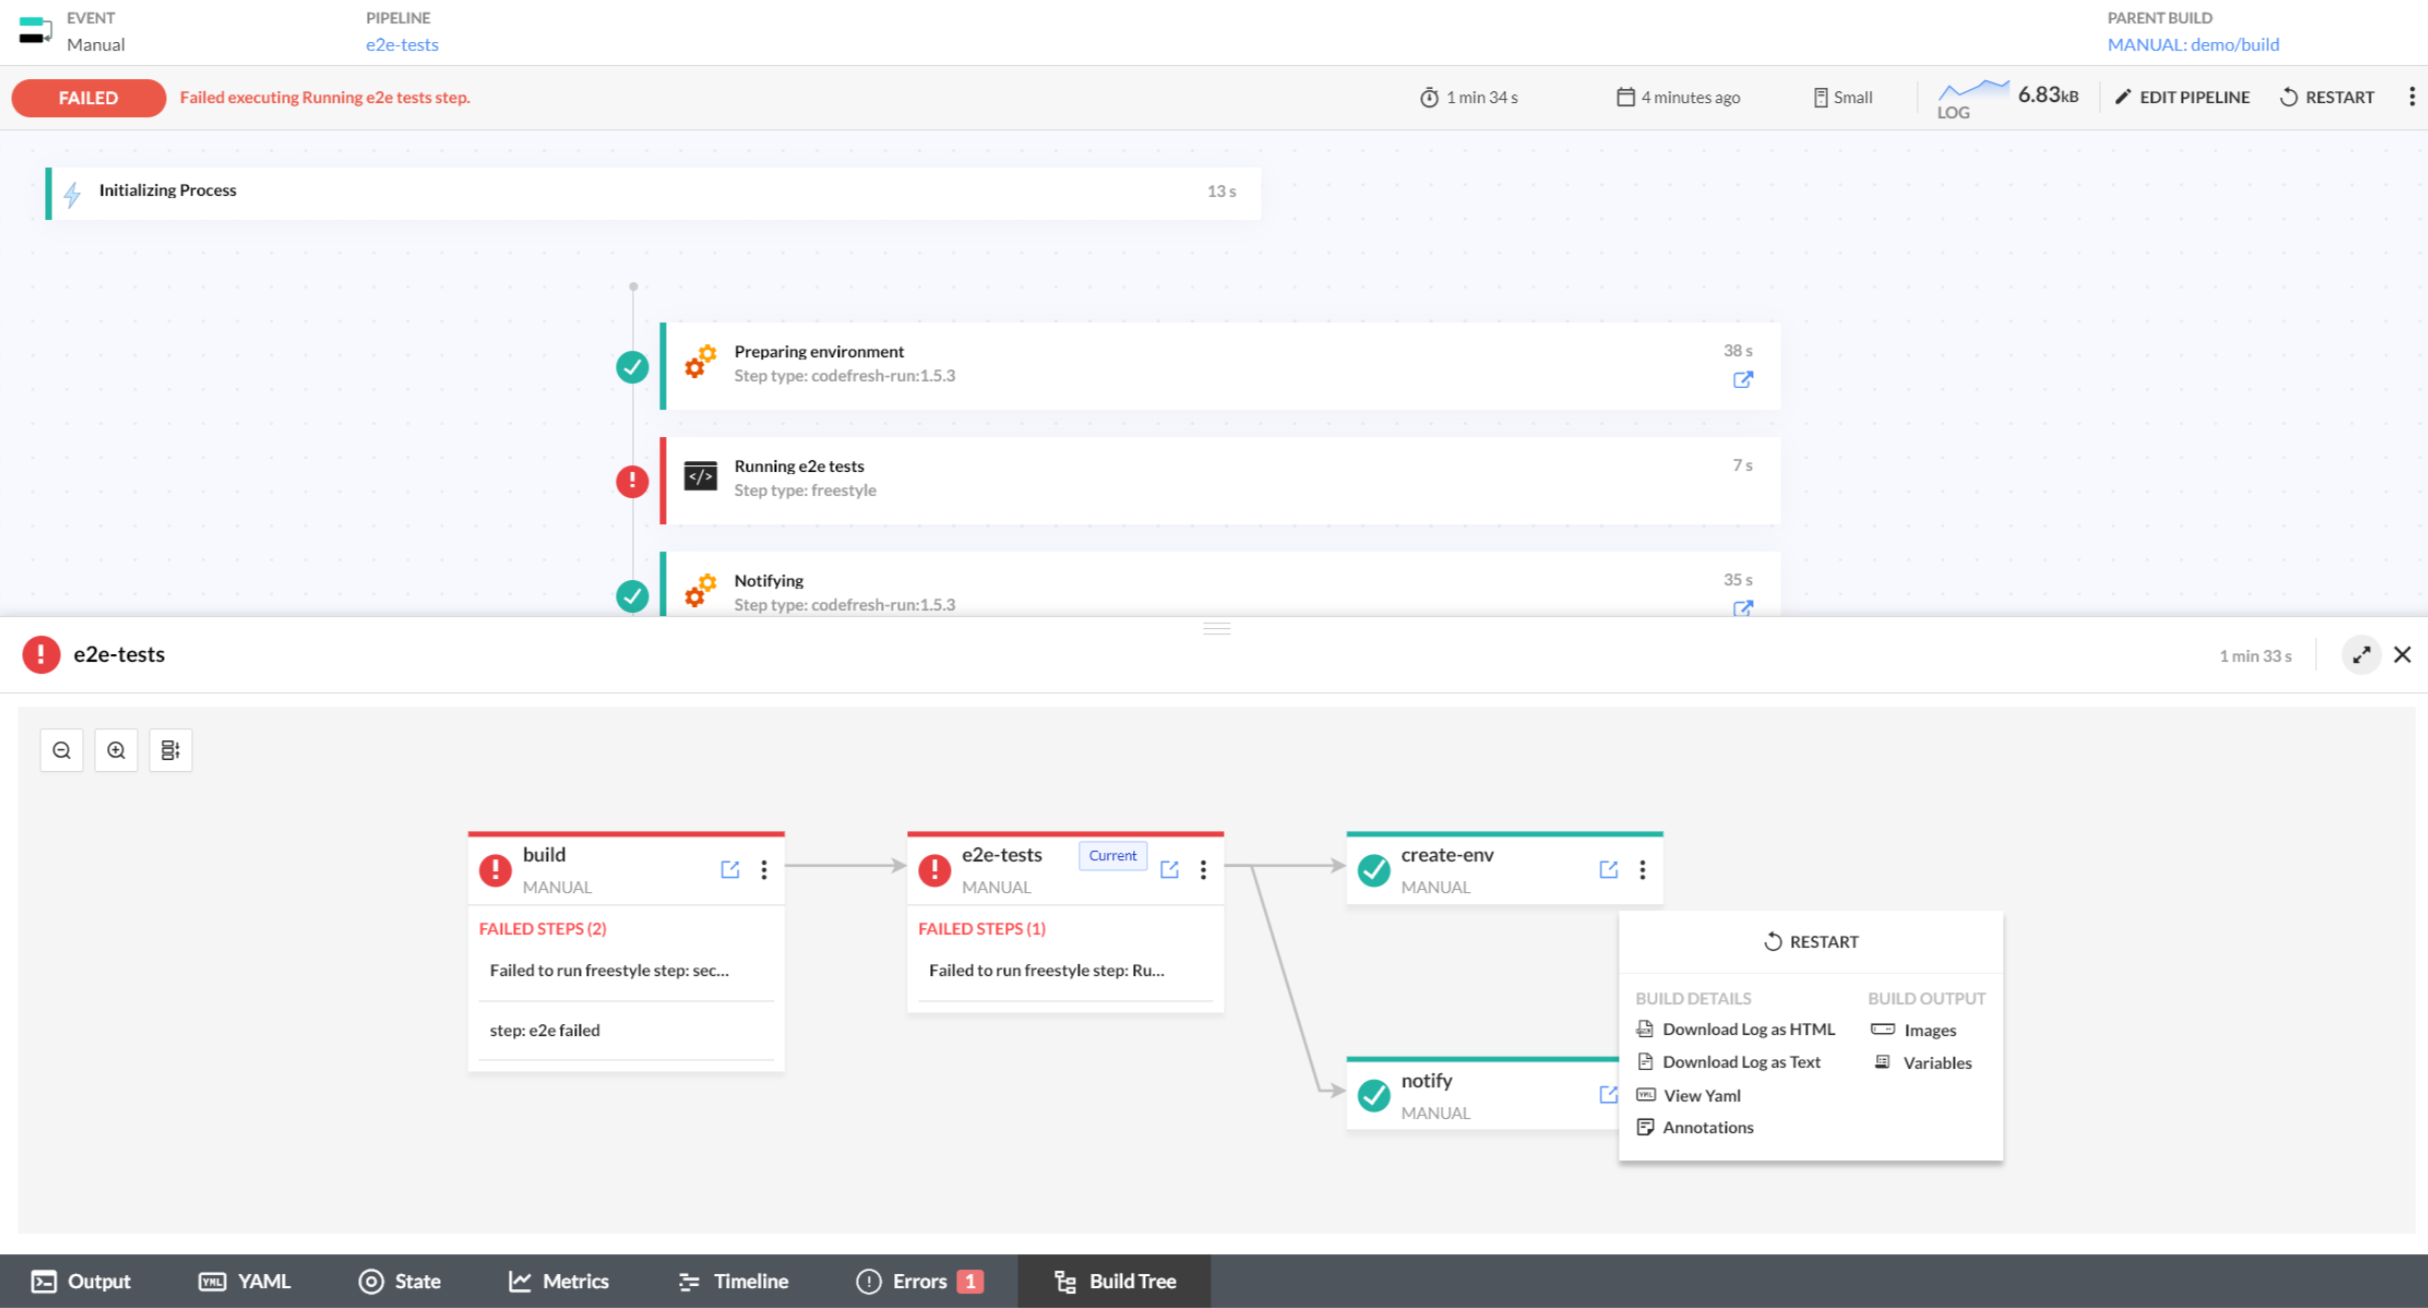
Build Tree view
Here’s an example of the Build Tree for a pipeline build displaying the hierarchical relationships between the selected and interconnected builds.
TIP
To view different areas of the Build Tree, drag the mouse to pan horizontally or vertically.
-
Build reference point
The selected build is the focal point to all linked builds. For easy identification, the selected build is tagged as Current. - Build status
- Every build displayed in the Build Tree showcases its status.
- For easy identification and alerting, steps in builds with an error status or a status requiring manual action are always displayed.
These statuses include:- Denied
- Failed
- Pending Approval
- Terminating or Terminated
-
Build context menu
Every build has a context menu for quick access to useful actions available for an individual pipeline build. -
Navigation to individual builds
Clicking for any build opens the Builds page displaying the step-view for that build.
 - View controls
View controls located at the top left:- Allow zooming in or out.
- Collapse all: Restores the default view of the Build Tree and collapses builds without errors (Success, Pending, Approved statuses).
Monitoring pipelines outside the Codefresh UI
You don’t always have to be in the Codefresh UI in order to monitor the status of your builds.
Monitoring pipelines that check Pull Requests
One of the most important roles of a CI platform is to automatically update the status of a GIT Pull request with the result of the respective build.
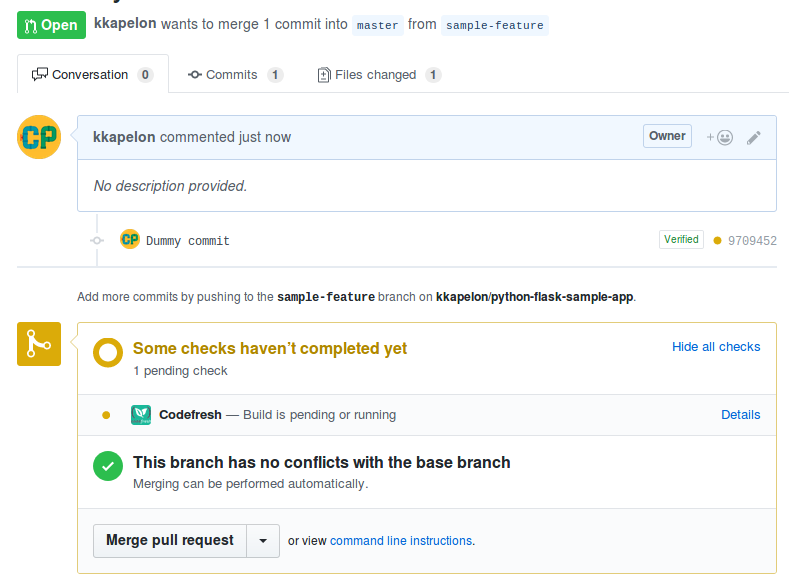
If you have set up a Git trigger in Codefresh, then by default this happens automatically without any other configuration for all automated commits from webhooks.
If you start a build manually then by default the git status will not be updated (i.e. the result of the pipeline will not affect the status of Pull request)
If you don’t want this behavior to happen, you can enable the git status update checkbox when you launch a pipeline.
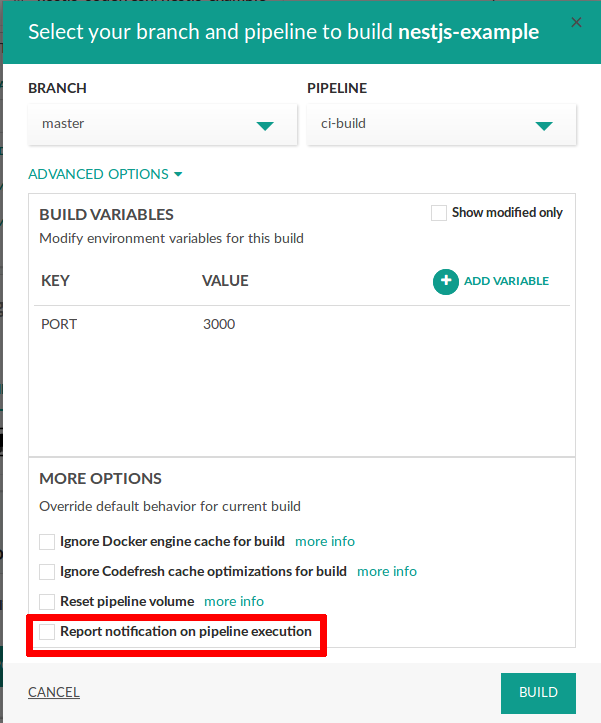
This way the pipeline status will change the build status even with manual builds.
The same behavior is also available to the Codefresh CLI. In that case use the parameter --enable-notifications
to specify if manually triggering a build will also change the GIT status.
For open source projects you also have the ability to trigger builds from external forks.
Viewing pipeline status from text/html files
Codefresh also supports build badges that allow you to show the status of a Pipeline in Text files or web pages.
![]()
See the build badges page for more information.
Related articles
Codefresh YAML for pipeline definitions
Steps in pipelines
Test reports
Status badges