Datadog pipeline integration
Integrate Codefresh pipelines with Datadog for monitoring and analysis
Datadog is a SaaS-based monitoring and analytics platform for large-scale applications and infrastructure. Integrating Datadog with Codefresh allows you to leverage Codefresh to create your pipelines, and Datadog to monitor and analyze them.
When a pipeline completes execution in Codefresh, Codefresh reports pipeline-execution data to Datadog for viewing in Datadog’s Continuous Integration (CI) Visibility interface.
For Datadog and Codefresh integration, you need:
- An API token from your Datadog account
- To define the settings in Codefresh
NOTE
If you’re interested in enabling Datadog for your account, please reach out to Support.
Get API token from Datadog account
If you already have a Datadog account, you can copy the API key if you have one, or generate a new API key.
- Log in to your Datadog account.
- Go to Organization Settings, and select API Keys.
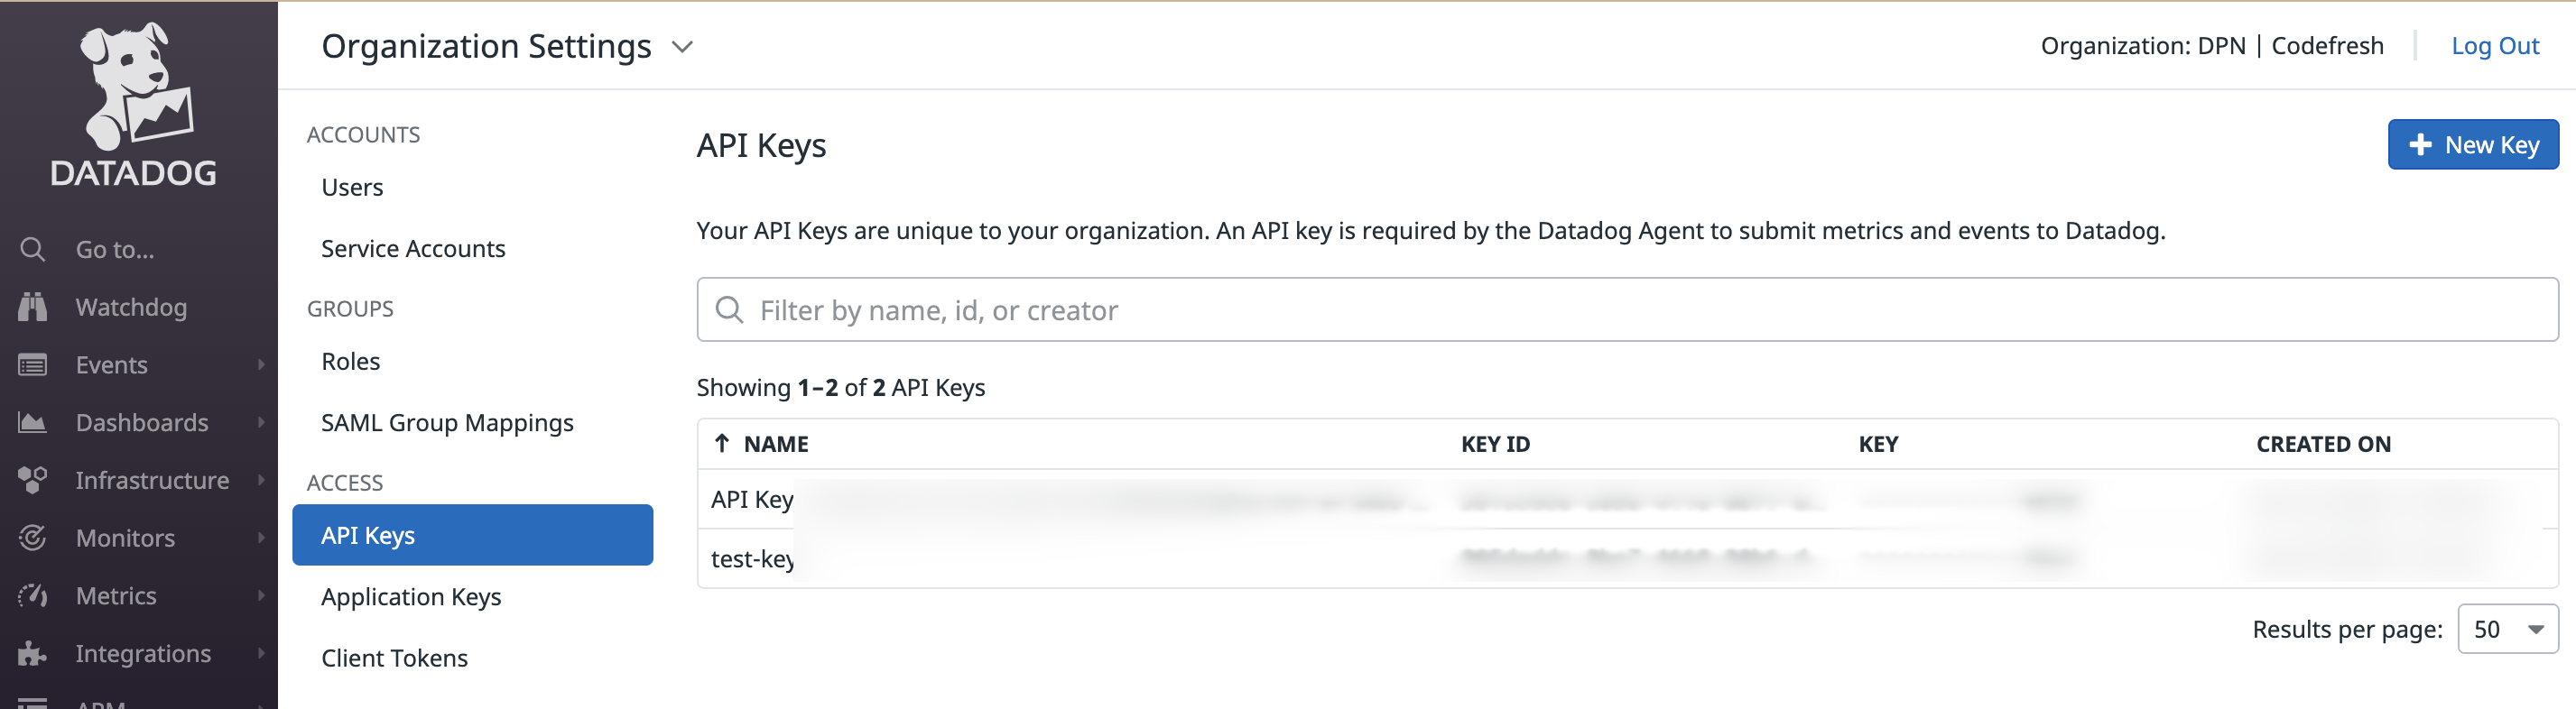
- Copy the API key to use with your Codefresh integration.
Set up Datadog integration in Codefresh
Configure the integration settings for Datadog within Codefresh.
- In the Codefresh UI, on the toolbar, click the Settings icon, and then from the sidebar, select Pipeline Integrations.
- Select Datadog, and then Configure.
- Click Add Integration.
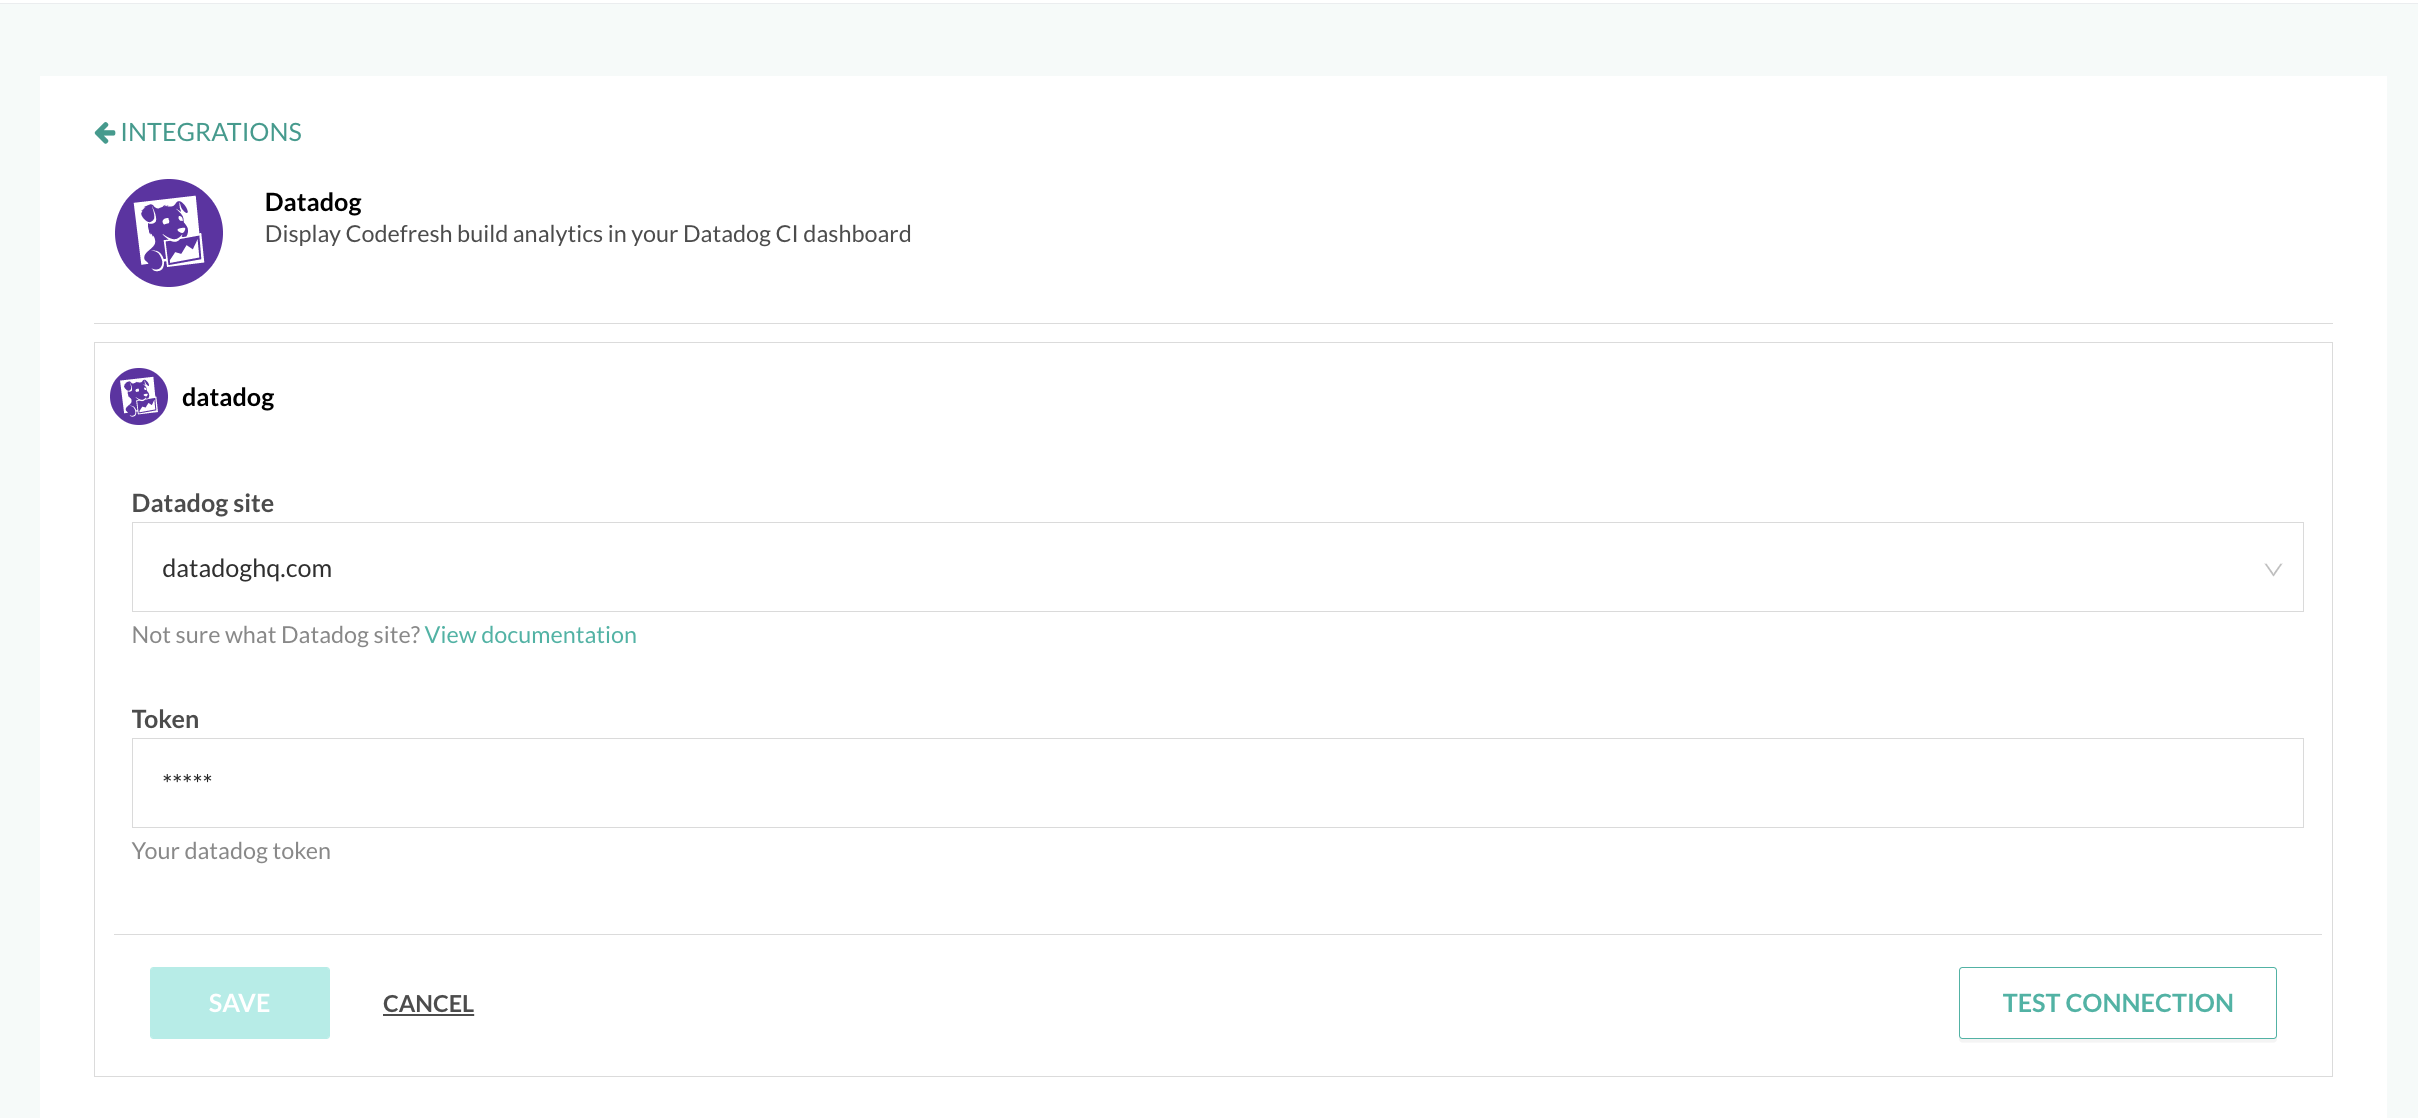
- Define the following:
- Datadog site: Select the site with your data. If you are not sure which Datadog site to select, select the View documentation link below the field, and read Datadog’s official documentation.
- Token: The API token you copied from your Datadog account.
- To verify the connection details, click Test Connection.
- To apply the changes, click Save.
Pipeline data from Codefresh in Datadog
See pipeline data in Datadog’s CI Visibility interface.
We have highlighted the main features in Datadog for Codefresh pipelines. For details, see the information in Set up Tracing on Codefresh Pipelines.
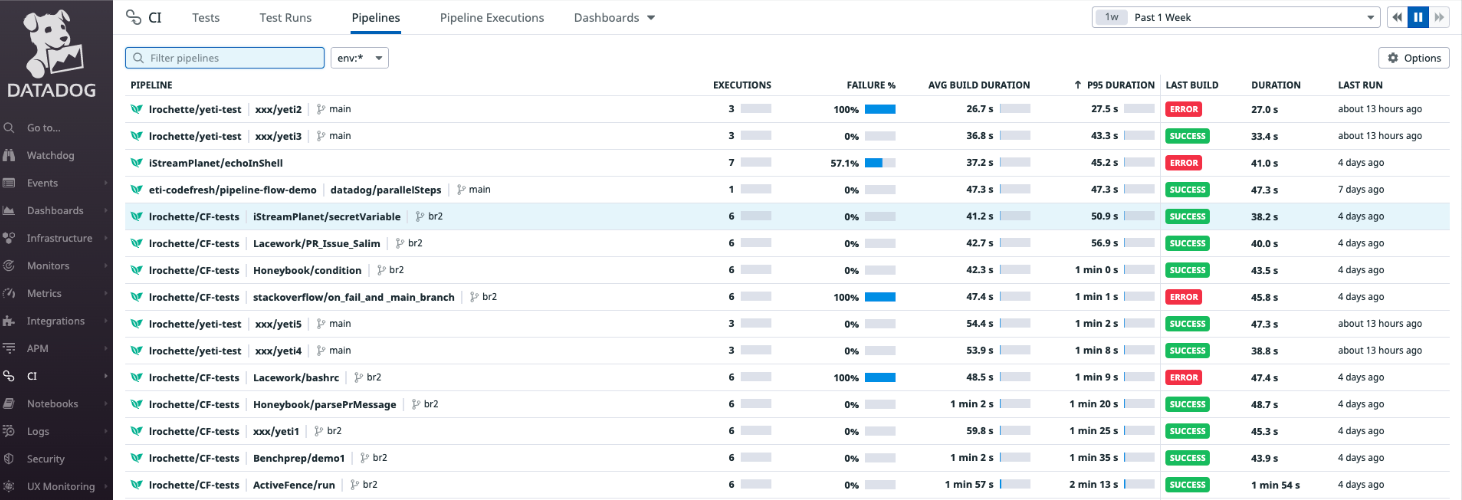
Pipelines page in Datadog
The Pipelines page shows aggregated data for each pipeline, for the selected time range. You can see the failure rate and average build duration against the total number of executions of a pipeline, alongside the metrics from the most recent build of the same pipeline.
Below is an example of the Pipelines page with Codefresh pipelines, prefixed by the Codefresh logo.
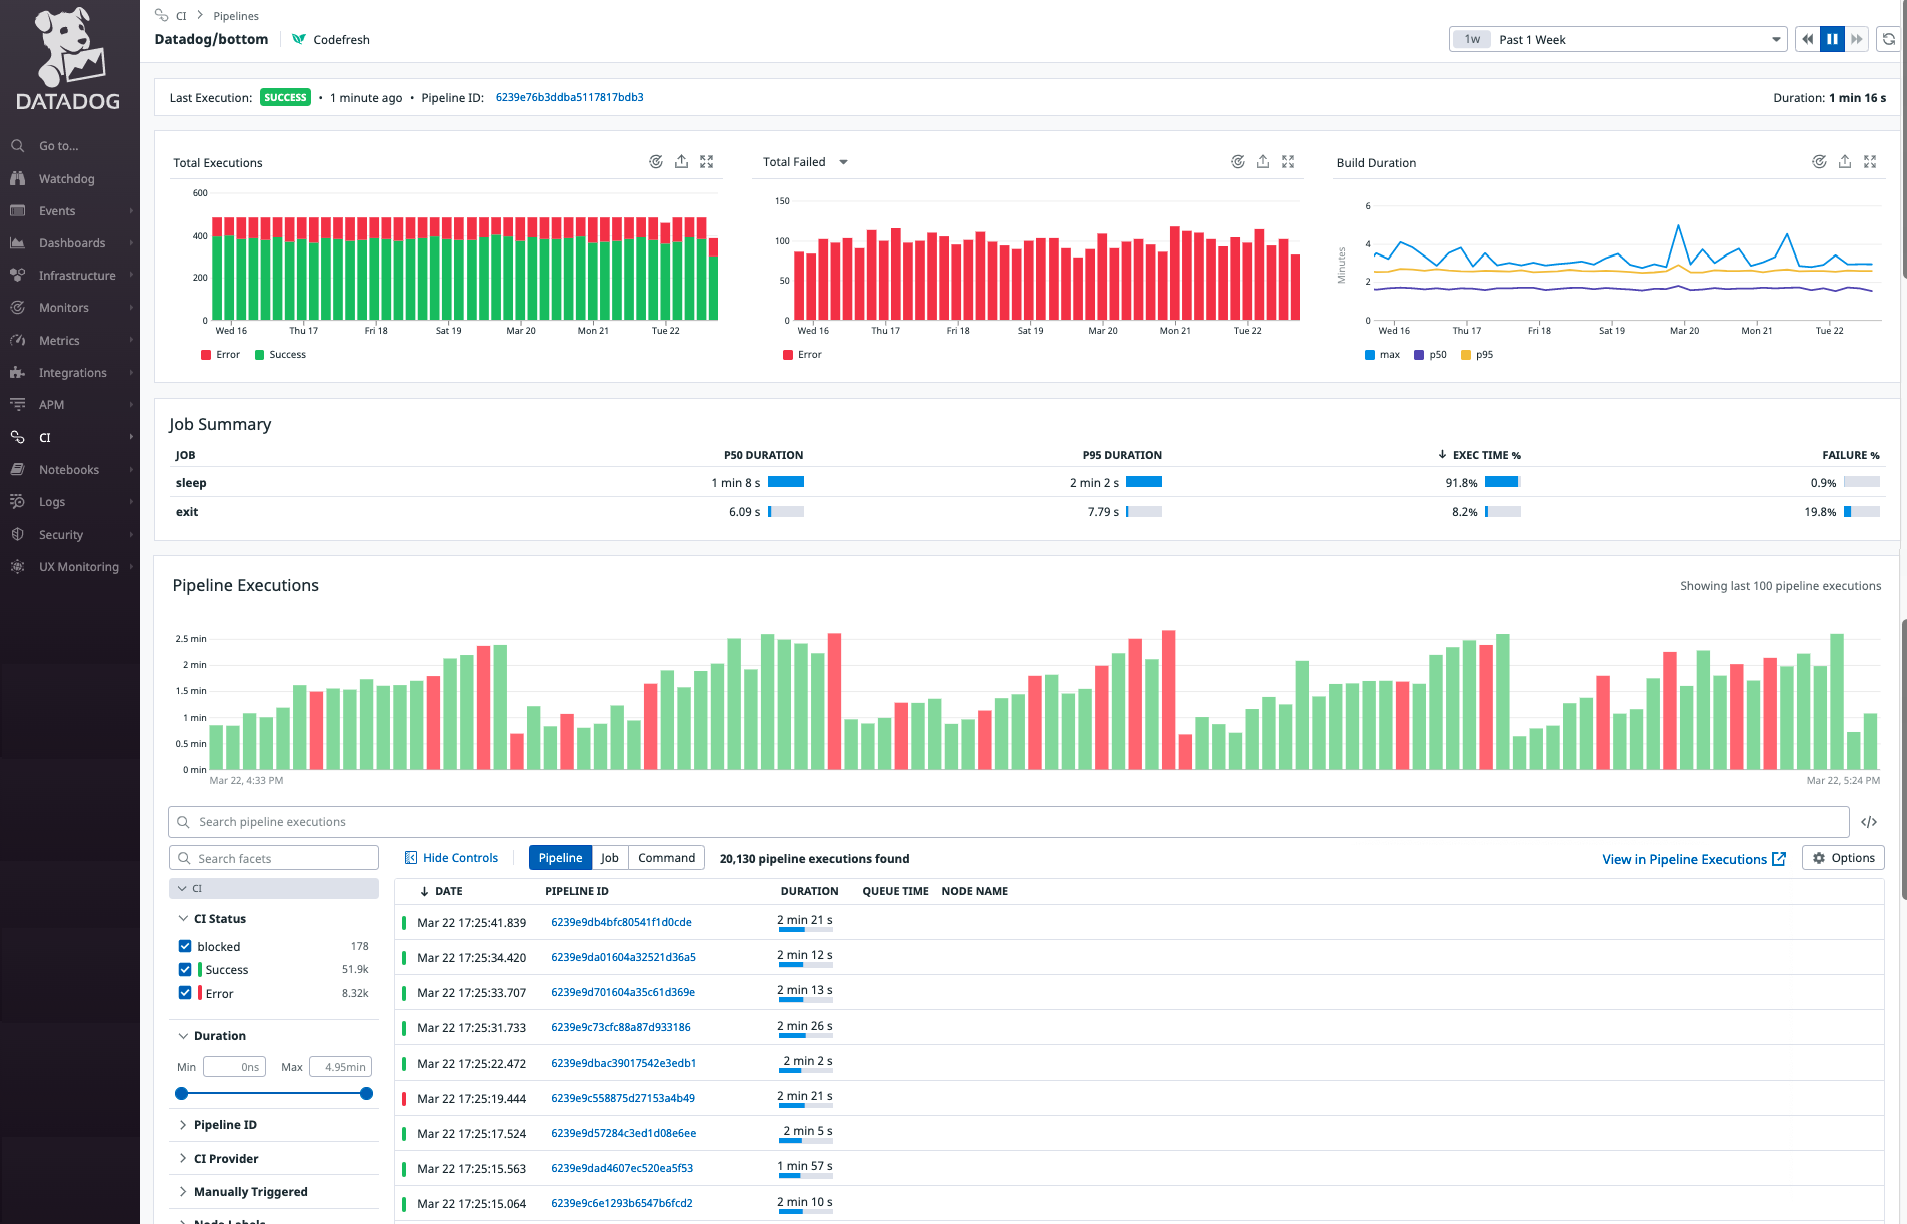
Pipeline Details page in Datadog
Selecting a pipeline takes you to the Pipeline Details page in Datadog which provides in-depth data for the pipeline. Here you can see the failure rate and average build duration for the selected pipeline, and data on its branches, and jobs (referred to as steps in Codefresh). You also have the option of viewing executions in the dedicated Pipeline Executions page.
Below is an example of the Pipeline Details page for the selected Codefresh pipeline.
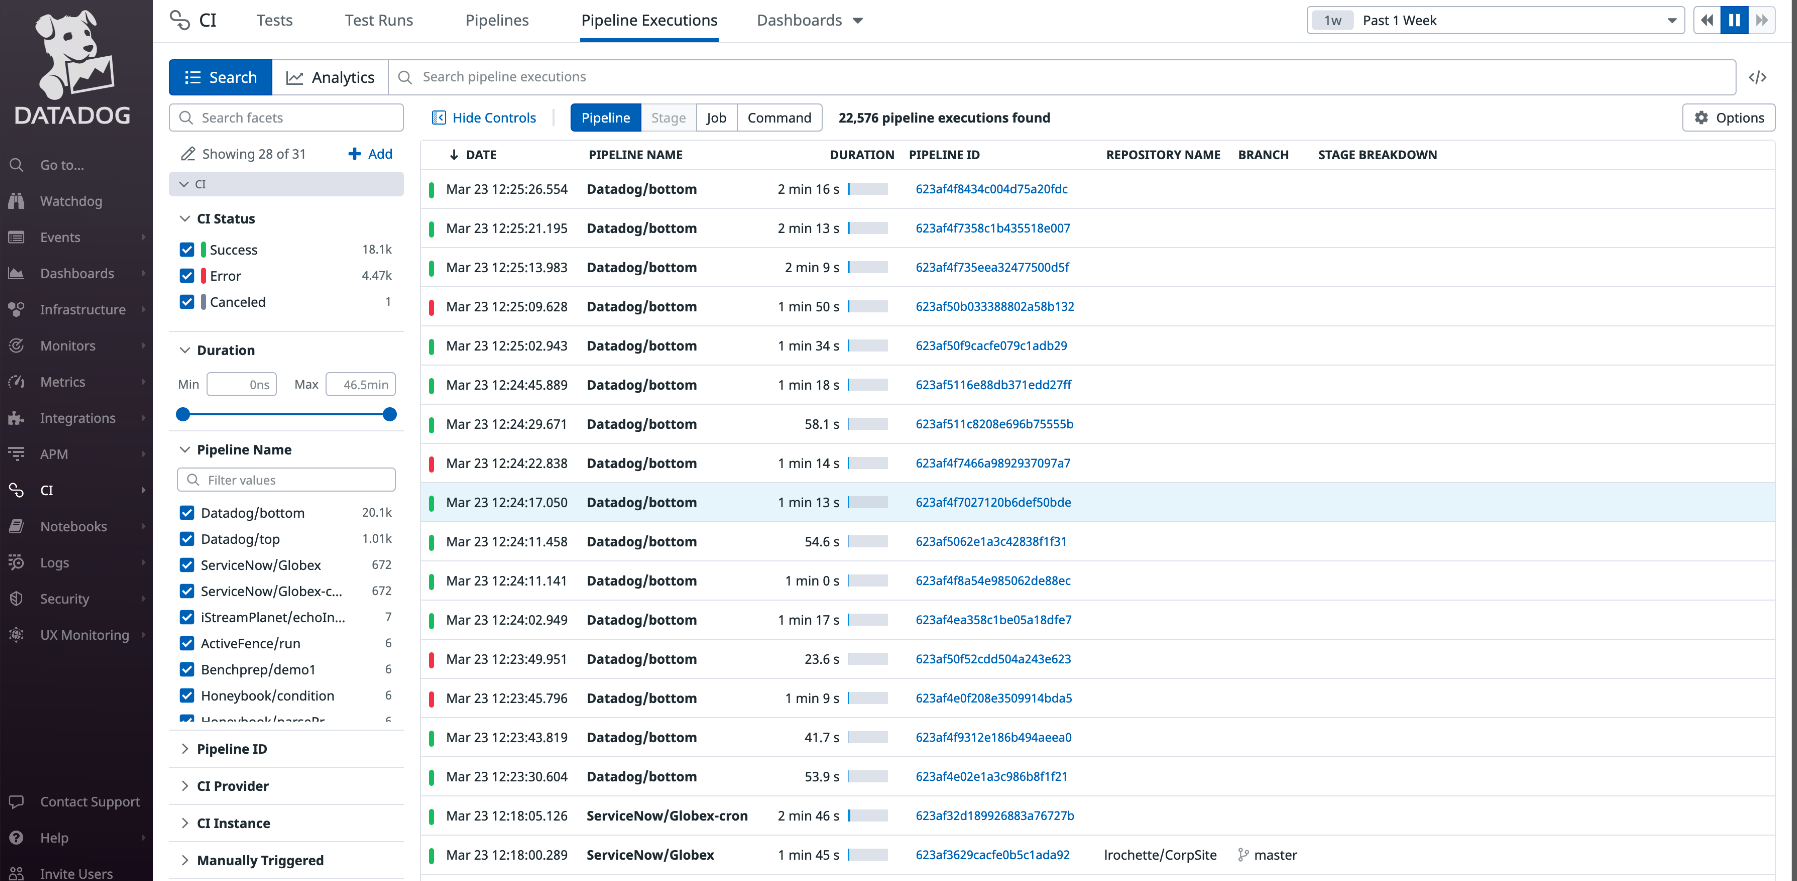
Pipeline Executions page in Datadog
The Pipeline Executions page shows day-by-day execution data for the selected pipeline or pipelines.
Below is an example of the Pipeline Executions page with execution data for Codefresh pipelines.
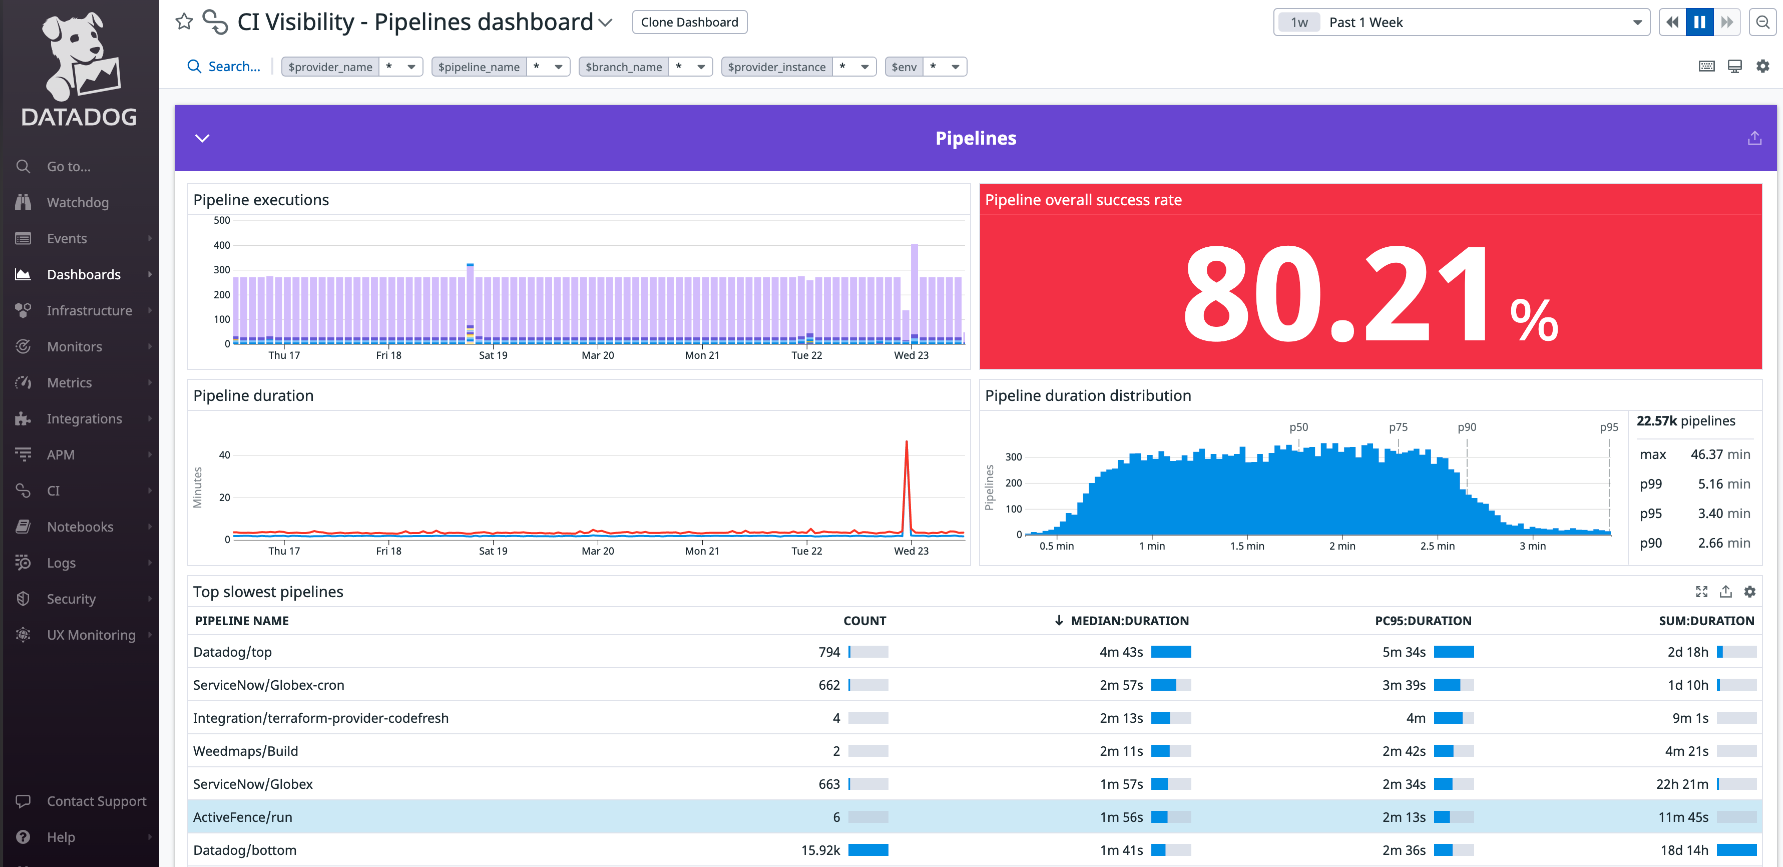
Pipeline Dashboards page in Datadog
Pipeline Dashboards is your go-to location for a quick look at performance and step metrics across pipelines. You can customize the widgets in the dashboard to display the data that is of interest to you.
Below is an example of the Pipeline Dashboards page.