Debugging pipelines
Pause and inspect pipelines
In addition to running pipelines locally, Codefresh also allows you to debug pipelines by stopping their execution and inspecting manually their state (files, environment variables, tools etc.)
The Codefresh pipeline debugger works similar to your IDE debugger. You can place breakpoints on one or more pipeline steps and once the pipeline hits one of them, it will stop. You will then get a terminal like interface inside your pipeline step where you can run any commands that you wish in order to understand the state of the container.
There are several options for defining exactly when a step will stop.
Entering the debugger mode
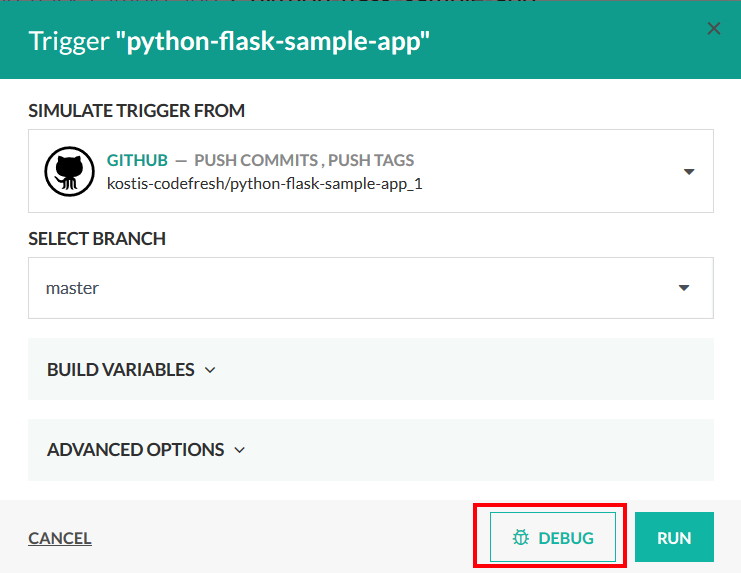
There are threes ways to enter the debugging mode in a pipeline. You can activate the debugging button when your run the pipeline:
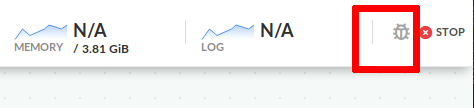
Alternatively if a pipeline is already running normally, you can enter debugging mode by clicking on the bug icon on the top right.
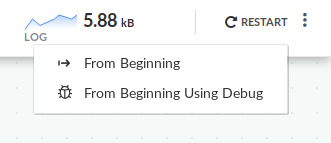
You can restart a pipeline that has already finished in debug mode:
Now you are ready to place breakpoints in steps.
Placing breakpoints
Once the debugging mode is active, all pipeline steps will get an extra breakpoint icon on the far right of their box.
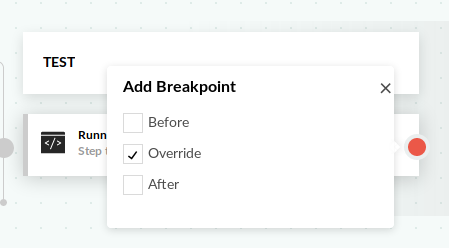
You can click on this icon and define a breakpoint for this particular step. You have the following options
- Before - place a breakpoint before the step is initialized
- Override - place a breakpoint after the step has initialized but before its execution (freestyle steps)
- After - place a breaking point after the step has finished execution.
You can choose multiple debugging phases. In most cases the Override option is the most useful one. The before phase allows you to inspect
a pipeline step even before service containers are up.
The after phase is useful if you want to verify files or variables after a step has finished its execution but before the next step starts.
Using the debugger terminal
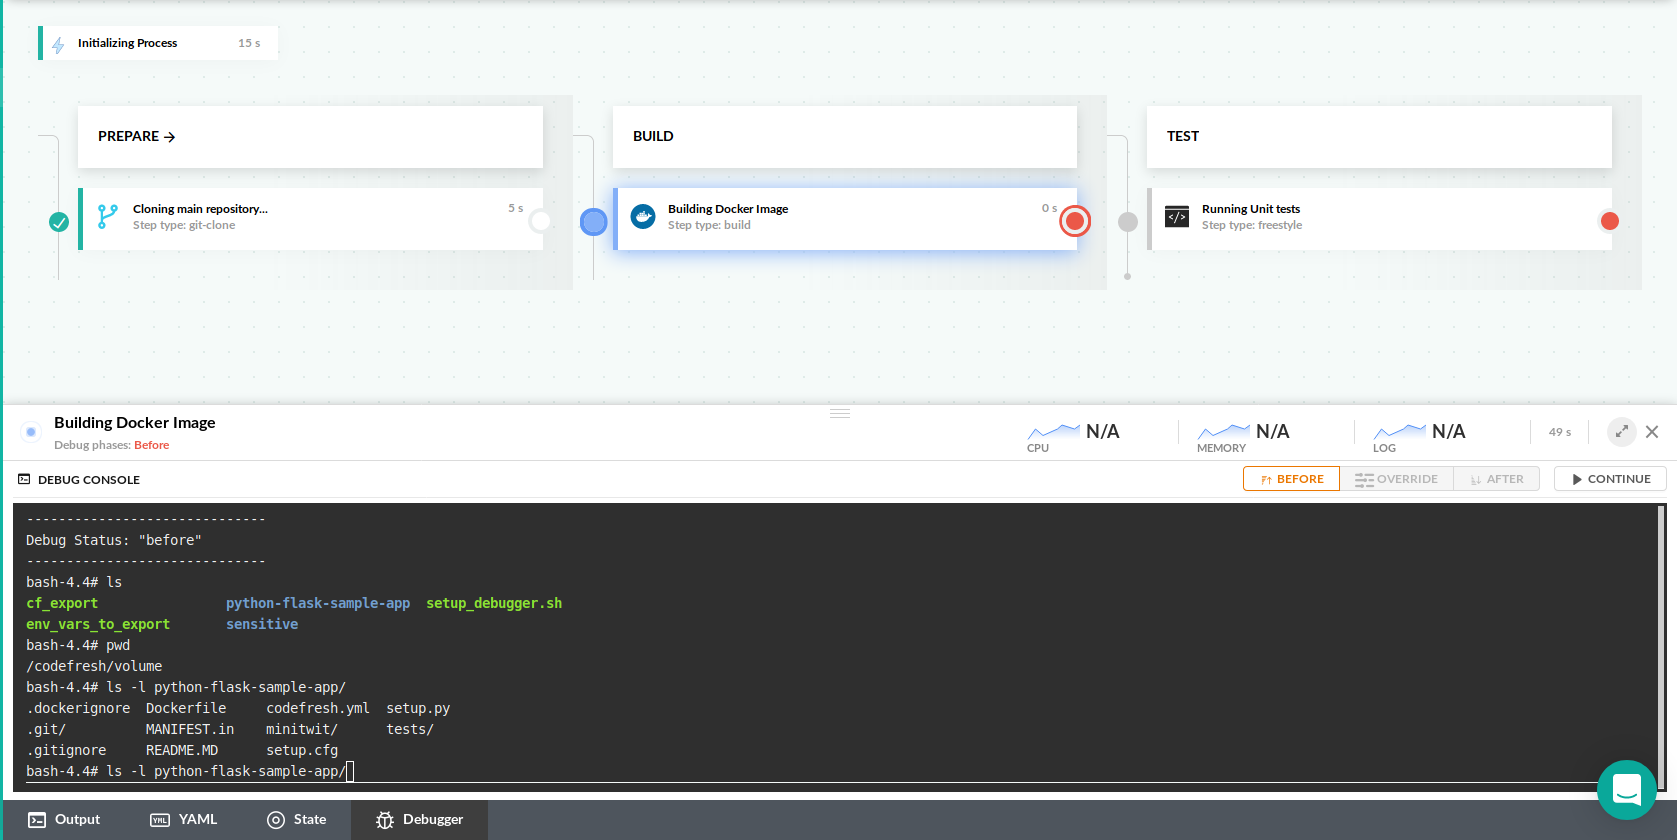
Once the pipeline reaches a step that has a breakpoint, execution will pause and a new debugger terminal will become available:
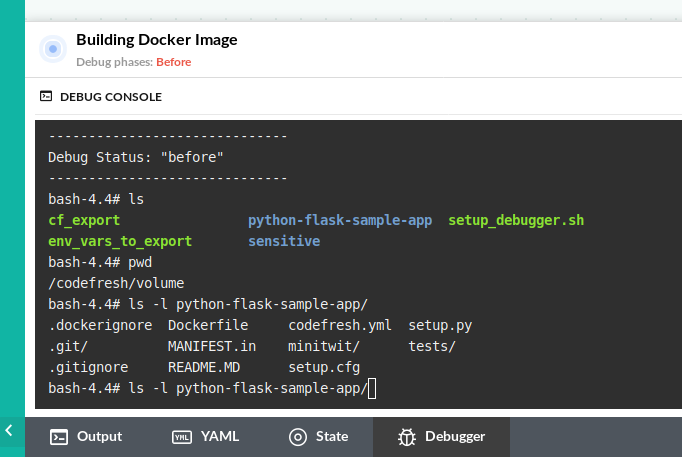
You can now manually type commands to inspect your container. If your Codefresh plan has the basic debugging capabilities you can run the following commands:
cd, lsto see filesprintenvto see environment variablescatto read filestopto see what is runningexportand cf_export to create environment variablesexitto finish the debugging session
If you have placed a breakpoint in the override phase of a freestyle step then the container image is the same as the one defined in the step. Therefore you can execute all tools that you have placed in the image (e.g. compilers, linters, test frameworks etc.)
In all cases the shared Codefresh volume is automounted so you can examine your source code or any other intermediate artifacts placed in your project folder or the pipeline cache.
If the breakpoint is on a before or after phase, the command line terminal is powered by an Alpine image. The image has already useful tools such as wget, nc and vi. If you have the advanced debugging capabilities in your Codefresh plan you can then install additional tools on your own directly in the terminal with apk. Examples:
apk add curlapk add nanoapk add goapk add python
Use the command apk search foo to search for a package named foo.
Resuming execution
Once you are happy with your debugging session, click the continue button to resume.
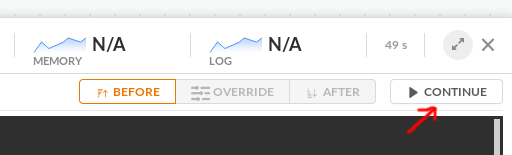
The pipeline will continue and then stop for the next breakpoint (if any). You can still revisit the debugger window for previous steps to see what debugging commands you had executed.
NOTE
To conserve resources, there is a 15 minute limit on each open debug session. If you don’t resume the pipeline within 15 minutes after hitting a breakpoint the whole pipeline will stop with a timeout error.
It is important to understand that if you have chosen the override phase in a freestyle step, then the commands mentioned in the pipeline definition are completely ignored.
Using the alternative debug window
If you enable the debugger on a freestyle step with the “override” option, Codefresh will install some extra tooling on the Docker image that is needed for the debugger itself.
By default, the internal debugger tooling is using node.js, so if your image is already based on Node.js, you might get version conflicts in your application.
You can enable an alternative debugger by passing the variable DEBUGGER_RUNNER = 2 on the whole pipeline:
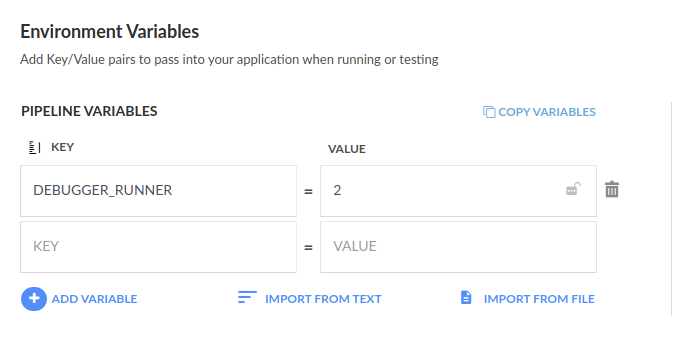
This debugger is based on Python instead of Node.js and it can work with both Python 2 and 3 Docker images. This way the debugger tools will not affect your application. You can also use the same method in a specific freestyle step like this:
codefresh.yml
version: '1.0'
steps:
  hello_world_step:
    title: freestyle step
    image: node:11.1
    environment:
      - 'DEBUGGER_RUNNER=2'
Inserting breakpoints in the pipeline definition
It is also possible to mention breakpoints in the Codefresh YAML instead of using the UI. Breakpoints mentioned in the codefresh.yml file have no effect when the pipeline is not running in Debug mode. You need to run the pipeline in debug mode in order for them to stop the pipeline.
Here is the syntax:
codefresh.yml
version: '1.0'
stages:
  - prepare
  - build
  - test
steps:
  main_clone:
    title: Cloning main repository...
    type: git-clone
    repo: 'codefresh-contrib/python-flask-sample-app'
    revision: 'master'
    git: github
    stage: prepare
  MyAppDockerImage:
    title: Building Docker Image
    type: build
    stage: build
    image_name: my-app-image
    working_directory: ./
    tag: 'master'
    dockerfile: Dockerfile
    debug:
      phases:
        before: true
        after: false
  MyUnitTests:
    title: Running Unit tests
    stage: test
    image: '${{MyAppDockerImage}}'
    debug:
      phases:
        before: false
        override: true
        after: false
    commands:
      - python setup.py test
Once you run this pipeline in debug mode, it will automatically have breakpoints in the respective steps (but you can still override/change them using the GUI).
Troubleshooting
The debugger windows needs some extra tools in a docker image in order to work (such as the bash shell). Codefresh automatically installs these tools on your image without any configuration.
If you get the message your linux distribution is not supported please contact us so that we can examine your docker image and make sure it is compatible with the Codefresh debugger.
Related articles
Codefresh YAML for pipeline definitions
Steps in pipelines
Running pipelines locally