Home dashboard
Global dashboard
Get a global picture of performance for GitOps entities and pipelines in the Home dashboard with system-wide visualization for all stakeholders.
The Home Dashboard includes two different dashboards:
- GitOps Dashboard
Displays a global overview of GitOps Runtimes, clusters managed by the Runtimes, deployment history, and most active applications.
- Pipelines Dashboard
Displays aggregated pipeline data for performance analysis, identification of bottlenecks, and trends.
GitOps Dashboard
Use the GitOps dashboard to:
- Identify status of GitOps Runtimes and the clusters managed by the Runtimes
- View deployment history for a date range
- View the most active applications, and filter by cluster to which they are deployed
- Navigate to the GitOps Apps dashboard to further analyze specific applications
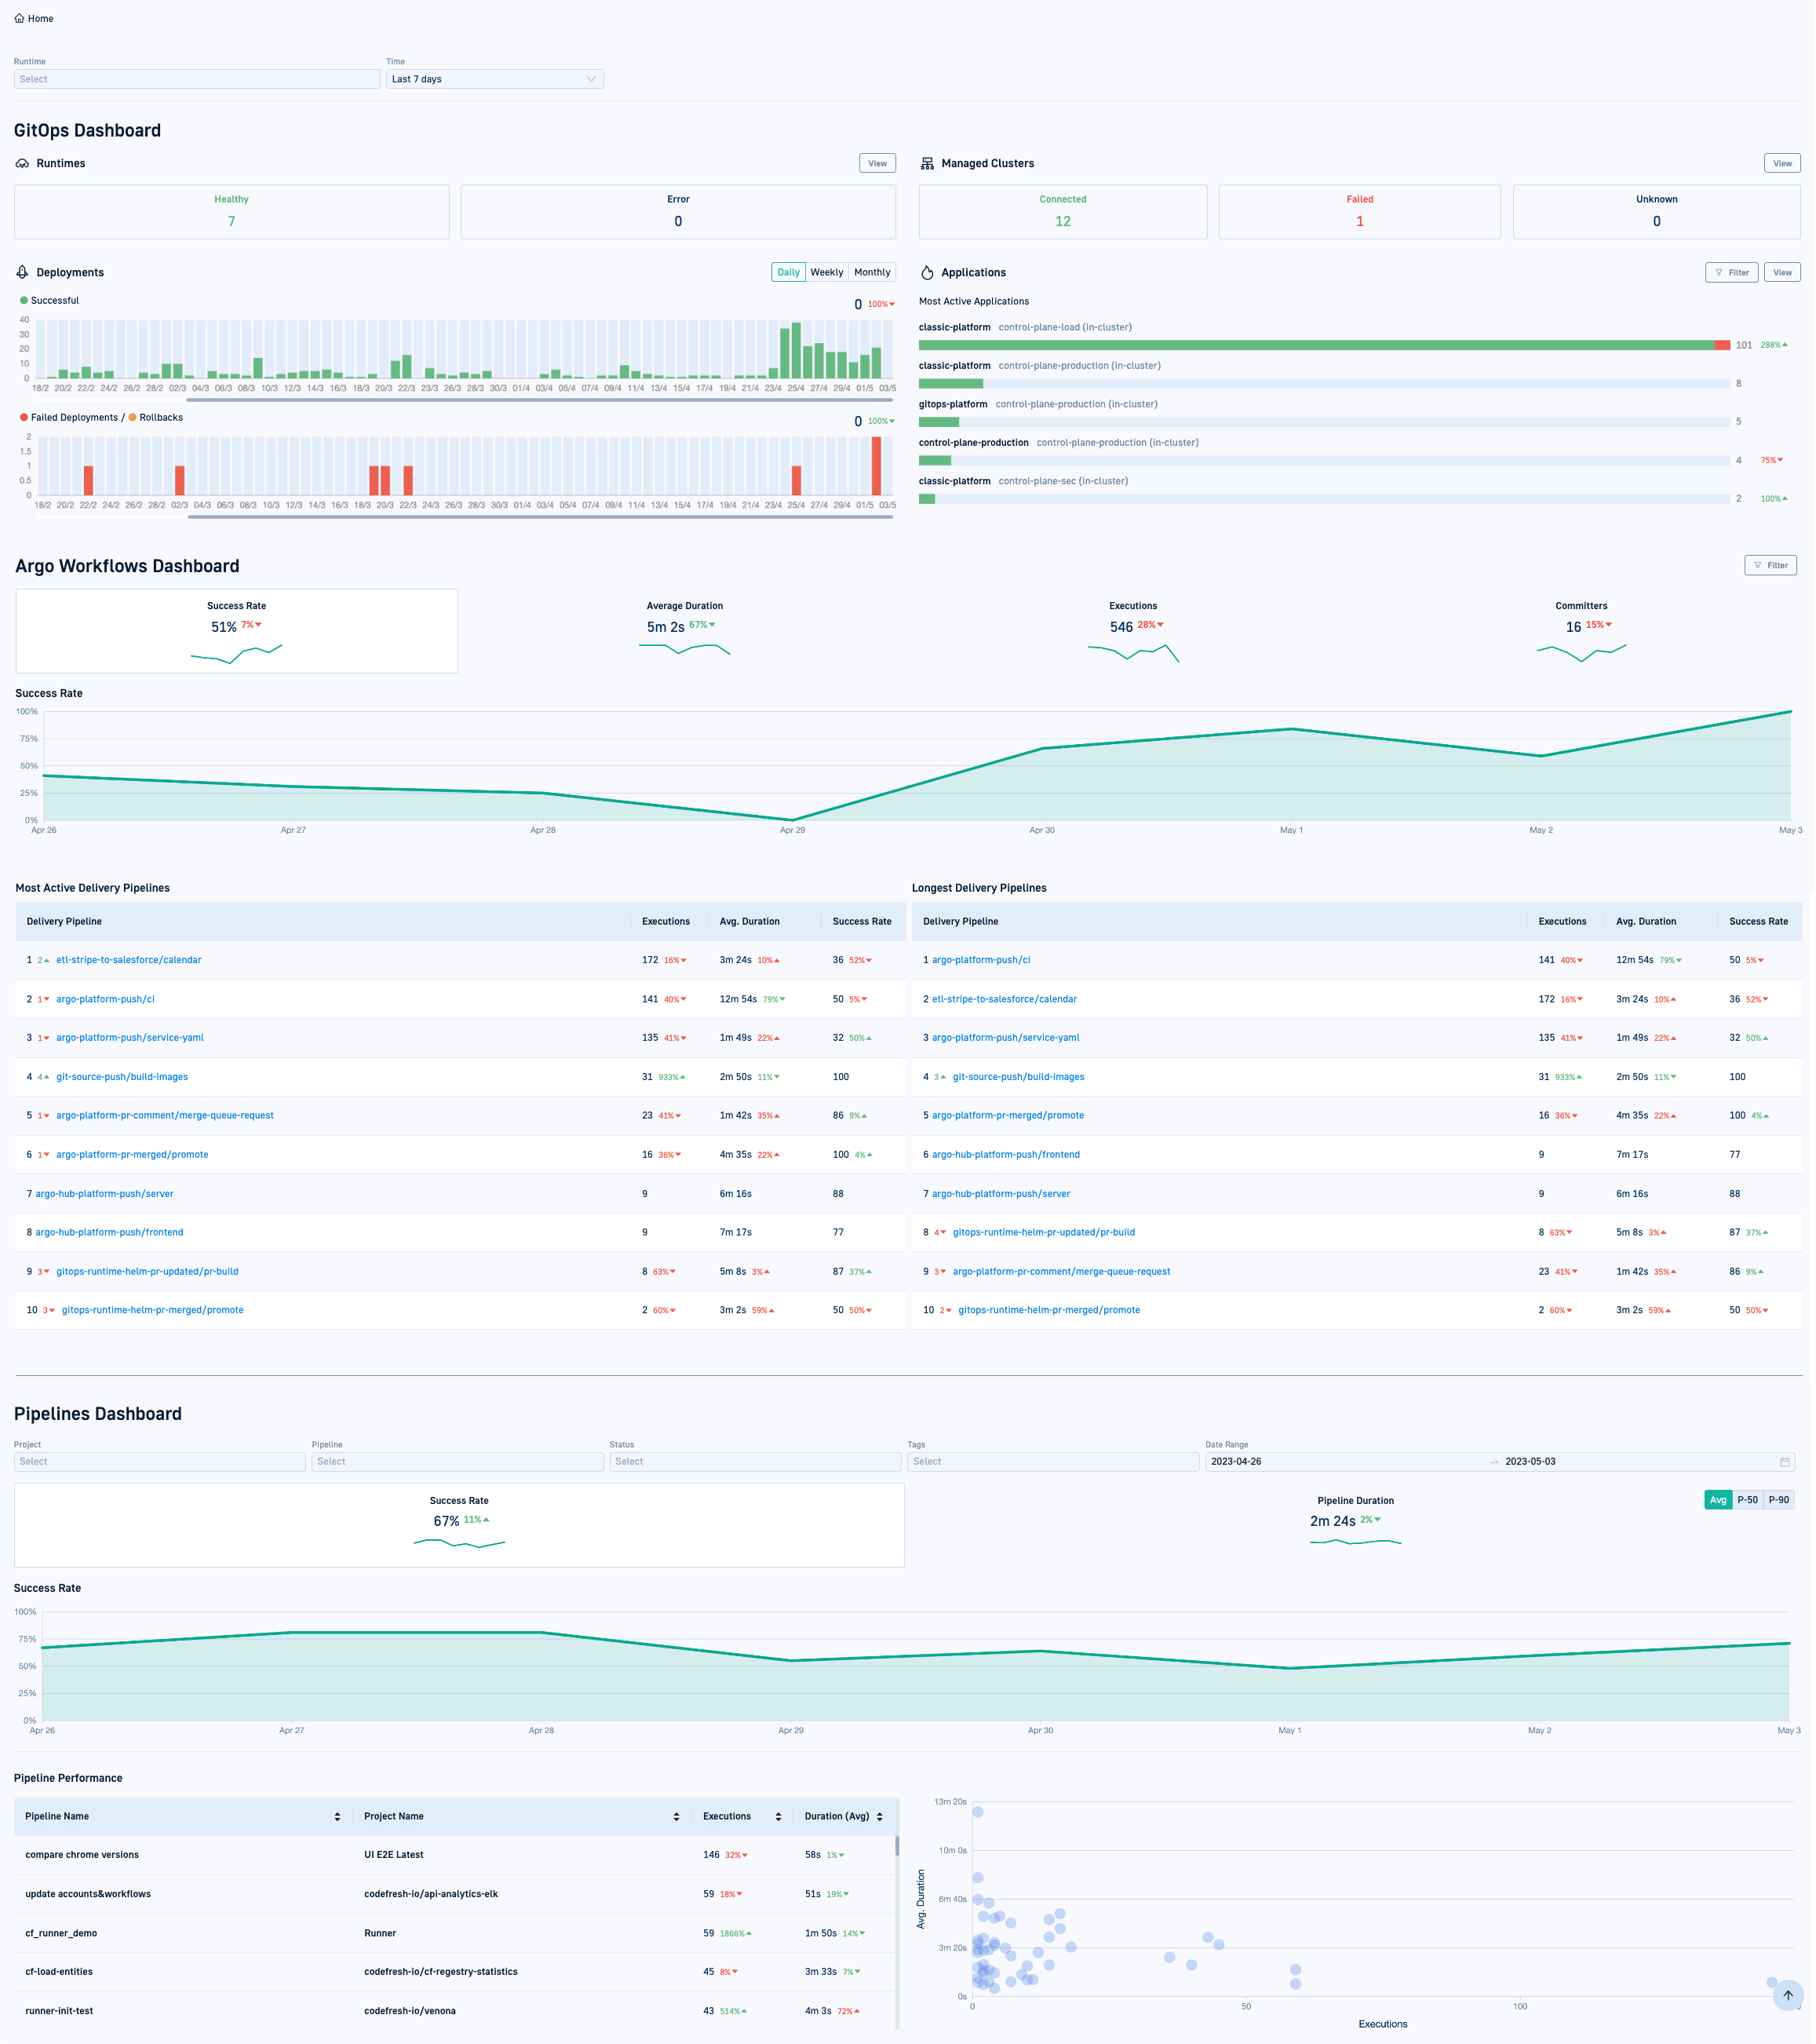
Filters for GitOps Dashboard
- Time
The date range filter is always active, and by default, shows data for the last seven days. - Runtimes
Select one or more GitOps Runtimes to focus on data by specific GitOps Runtimes.
GitOps Runtimes and Managed Clusters
Identify the health of the GitOps Runtimes and managed clusters in your enterprise.
- Health status is displayed for both Hosted and Hybrid GitOps untimes.
- Managed clusters are external clusters registered to GitOps Runtimes to which you deploy applications and managed resources.

| Item | Description |
|---|---|
| Runtimes |
|
| Managed Clusters |
|
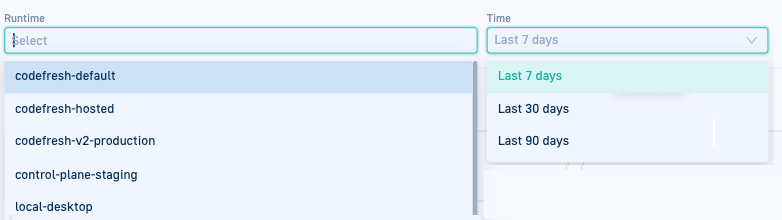
Deployments
View the deployment history for the selected date range, and the average number of successful, failed, rollback deployments for the selected granularity. Compare with the background period to identify trends.
| Item | Description |
|---|---|
| Daily/Weekly/Monthly | Granularity for deployment views that affects the average number of deployments and the comparison to the reference period. |
| Number and Comparison Average | The number on the top right is the number of successful/failed/rollback deployments for the selected granularity. The percentage is the comparison to the reference period, also for the selected granularity. |
| Successful | The number of deployments successfully deployed to the cluster per day, week, or month according to the selected granularity. |
| Failed Deployments | The number of deployments that failed and could not be deployed to the cluster, per day, week, or month according to the selected granularity. |
| Rollbacks | The number of deployments that were deployed to the cluster but had to be rolled back to a previously deployed version, per day, week, or month according to the selected granularity. |
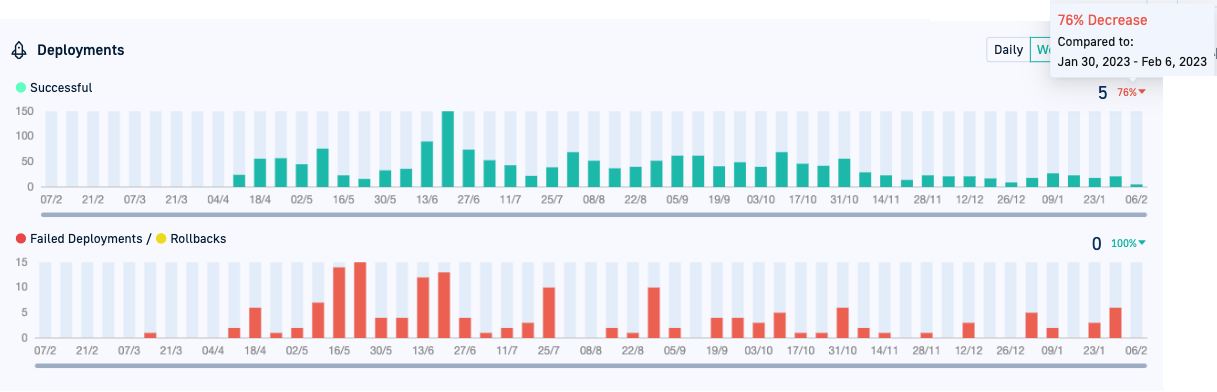
Applications
Displays up to five of the most active applications and their current deployment status.
| Item | Description |
|---|---|
| Filter | Filter applications by the clusters on which they are deployed, either by Cluster Name or by Cluster. |
| View | Click to go to the GitOps Apps dashboard. See GitOps Apps dashboard and Monitoring GitOps applications. |
| Application Name | The name of the application, and the names of the GitOps Runtime and the cluster on which it is deployed. Click the name to drill down into the application in the GitOps Apps dashboard. |
| Health status | The health status of the application, and can be either:
The number at the end of the bar is the total number of deployments for the application, and the percentage indicates the overall decrease or increase compared to the reference period. |
Pipelines Dashboard
View and analyze pipeline performance, identify bottlenecks, and trends for your CI pipelines in the Pipelines dashboard.
The dashboard displays aggregated data for pipelines, updated at 30-minute intervals. All stakeholders can get quick visibility into cross-project pipeline metrics.
Use the Pipelines dashboard to:
- Identify performance issues in pipelines, both in terms of number of executions and execution duration
- Identify spikes in specific pipelines
- Focus on the performance of a specific pipeline, or pipelines in a specific project
- Validate improvements by comparing current metrics to those in the reference time period
- Ensure that you are meeting defined SLAs
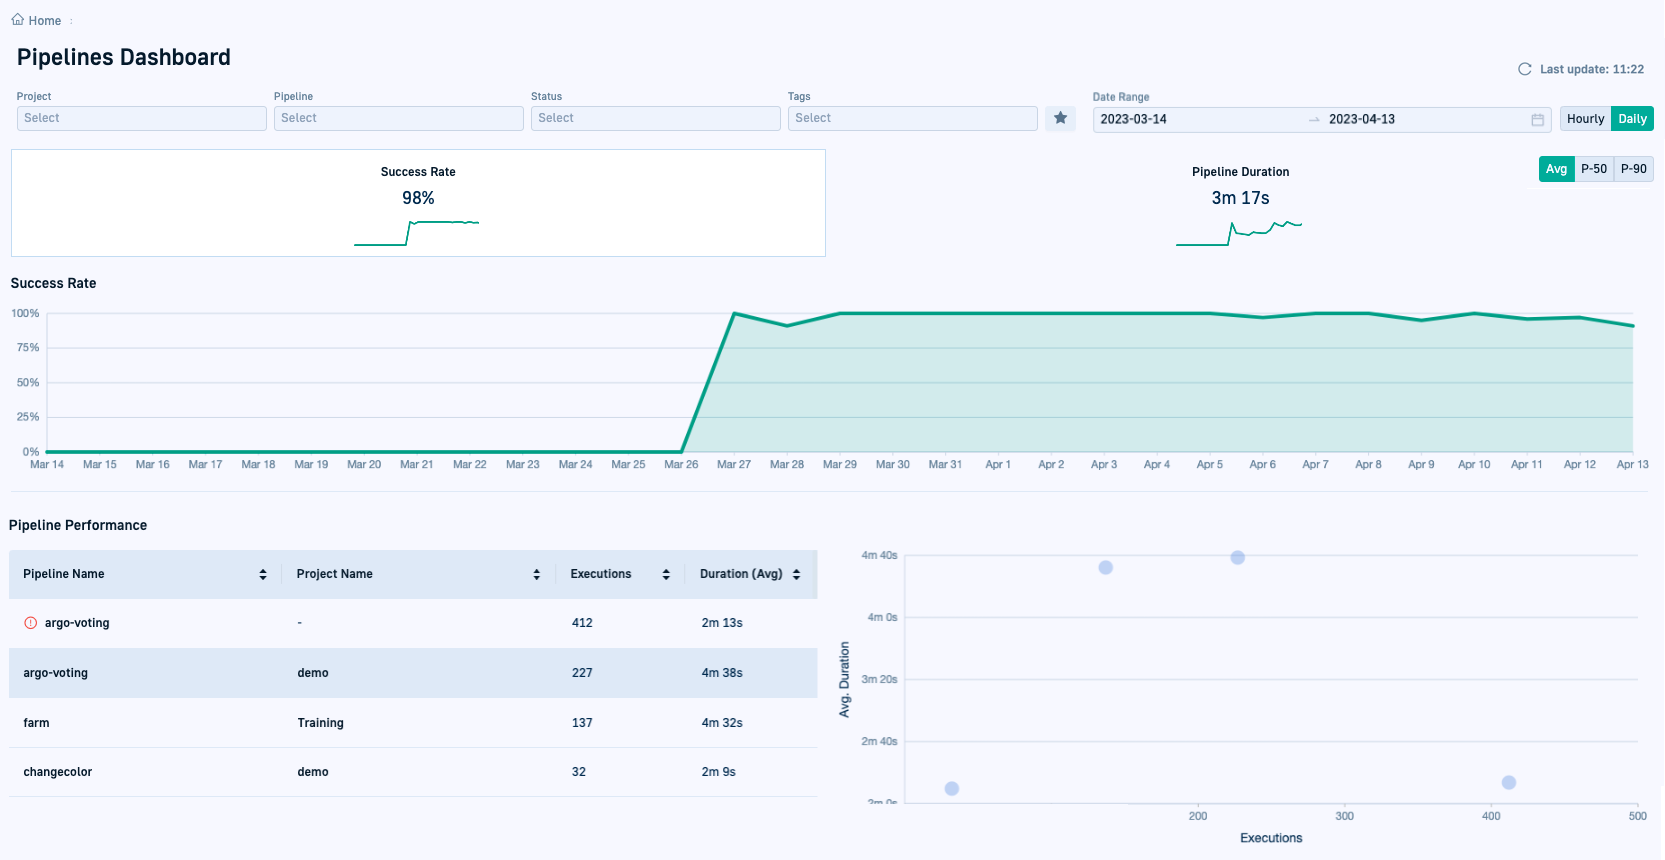
Filters for pipelines
Filters narrow the scope of aggregated data, allowing you to focus on the information you want to see.
Unless otherwise indicated, all filters support multi-selection.
TIP
Different filter types have an AND relationship.
| Filter | Description |
|---|---|
| Date Range | The time frame for which to view data. The date range affects the other filters, including the granularity for the Success Rate and Pipeline Duration charts. In addition to the predefined date ranges, you can select a custom date range of up to the last six months. If you select Today, then the Success Rate and Duration charts reflect hourly granularity. Every date range you select has a reference period corresponding to the same period of time preceding the selected date range. The reference period is used to derive comparisons and identify trends. |
| Hourly/Daily | Based on the date range selected, choose the granularity for viewing Success Rate and Pipeline Duration.
|
| Project | The project or projects to which the pipeline belongs. Selecting a project allows you to focus on the performance of pipelines assigned to it. If you starred one or more projects as favorites, and selected Projects, clicking |
| Pipeline | The pipeline or pipelines to filter by. Mouse over a pipeline name in the list displays a tooltip including the name of the project to which the pipeline belongs, followed by the name of the pipeline, to easily identify and select the correct pipeline. If you starred one or more pipelines as favorites, clicking |
| Status |
|
| Tags | The tag or tags assigned to the pipelines. |
| Filter to view only projects or pipelines that have been starred as favorites in the Projects/Pipeline pages. When you have starred projects or pipelines, the icon changes to Clicking it filters by favorite projects and pipelines. |
Pipeline success rate
The pipelines that completed execution successfully, from the total number of pipelines executed within the selected date range, as percentage.
NOTE
Pipelines in Pending status are excluded from the Success Rate calculations.
Pipeline duration
The time it takes for a pipeline workflow to complete the build, calculated from the total number of pipelines executed within the selected date range, unless you apply additional filters. You can switch between average (the default), and percentile views.
Duration as average or percentile
The average duration calculation shows the duration across all the pipelines within the selected date range. To better understand the performance over time, switch to duration by the median (P-50) or the 90th (P-90) percentiles.
The comparison percentage is derived from the reference time period. The reference period corresponds to the same length of time that precedes selected the date range.
Pipeline duration breakdown
The workflow of every pipeline can be divided into phases, some of which apply to all pipelines, while others depend on the settings configured for each pipeline. The initialization phase in the workflow is common to all pipelines. Other phases such as pending approval to continue execution, and pending execution due to concurrency limits, depend on the settings configured for each pipeline.
TIP
Each phase is color-coded for easy visualization. To show/hide phases in the chart, click the name of the phase in the legend.
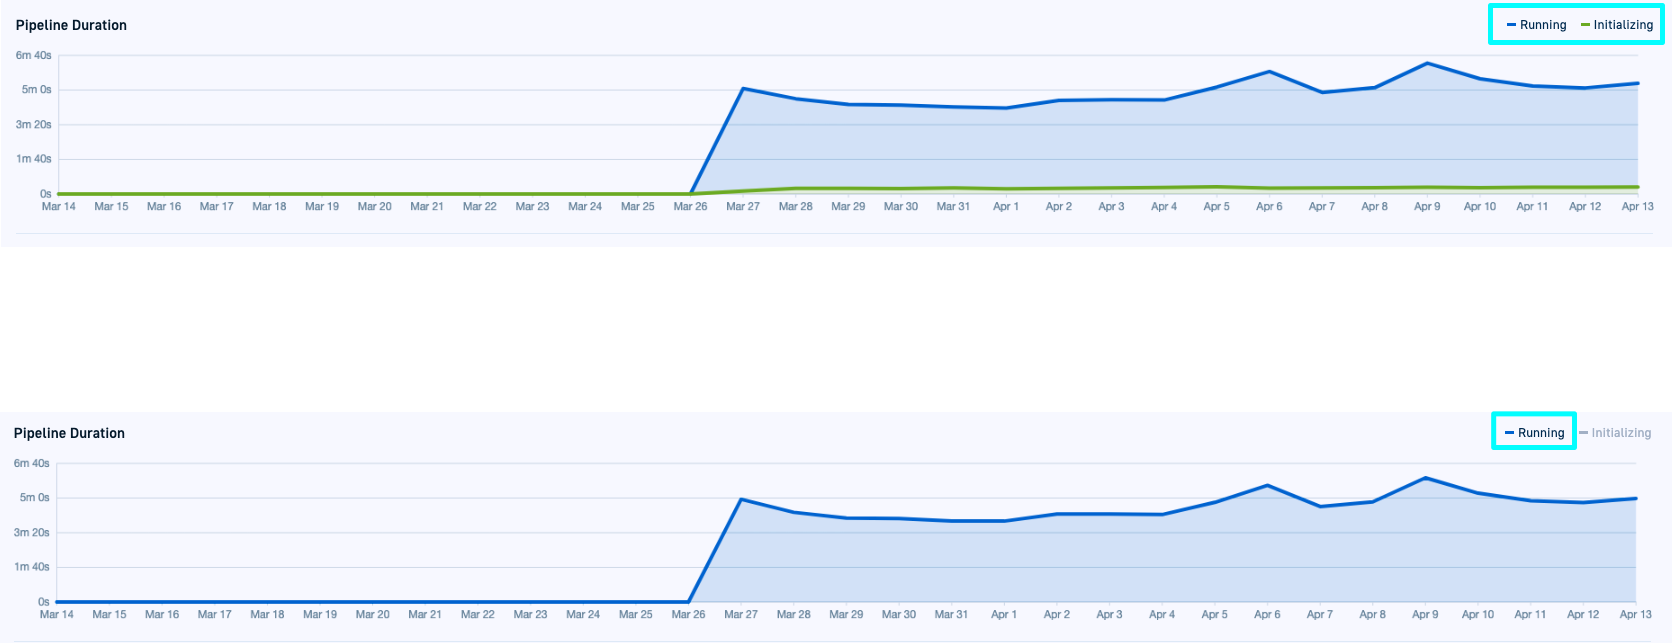
-
Pending approval
The average duration of pipelines pending manual approval to continue workflow execution. -
Running
The average duration of pipeline workflows in running state. -
Initializing
The average duration of pipeline workflows in the initialization phase. -
Pending concurrency policy
The average duration of pipeline workflows pending execution due to the concurrency limits configured for the pipelines. Workflows with pipeline, trigger, and branch concurrency limits are included in the calculation.
NOTE
Pipeline workflows pending execution due to concurrency policies are affected by the global account settings or the pipeline’s settings for Pending approval.
- Delayed due to license limit
The pipeline workflows pending execution due to the license limits configured for your account.
Pipeline performance metrics
Performance metrics for individual pipelines for the current and preceding time frames provide more insights and identify trends for pipelines.
- The list view shows pipelines sorted by average workflow build duration (default sort).
- The scatter chart shows all the pipelines, charted by number of executions (X-axis) versus duration (Y-axis). Every dot represents a pipeline.
The list view shows the following information.
| Metric | Description |
|---|---|
| Pipeline Name | A pipeline name prefixed with this |
| Project Name | The project to which the pipeline belongs. |
| Executions | The number of times that pipeline was triggered within the selected date range, with the comparison to the preceding (reference) date range in percentage. |
| Duration (Avg/P-50/P-90) | The length of time for the pipeline to complete execution according to the duration measure selected in the Duration chart. The comparison percentage is to the preceding (reference) date range. |
Correlate scatter chart with list view
Identify outliers in terms of executions and duration in the scatter chart map, and correlate with the list view. For example, a pipeline with more than 174 executions, that always exceeds 2 minutes in duration, can indicate potential for improvements.
- Clicking the dot that represents that pipeline in the scatter chart, changes the list view to show that and other pipelines with similar number of executions and duration.
- Clicking a row in the metrics table highlights the dot in the scatter chart that corresponds to that pipeline.
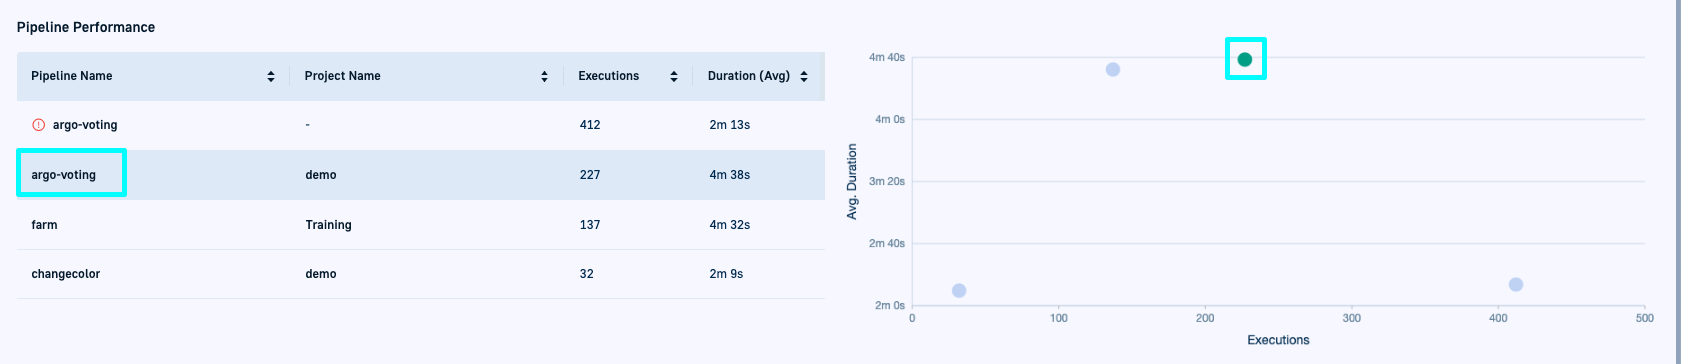
You can then filter by the specific pipeline or pipelines and analyze success rate, overall, and phase-level duration.