Progressive Delivery
Perform zero downtime deployments with Argo Rollouts
Progressive Delivery is the practice of deploying an application in a gradual manner, allowing for minimum downtime and easy rollbacks. There are several forms of progressive delivery such as blue/green, canary, a/b, and feature flags.
Codefresh can easily integrate with Argo Rollouts, a Kubernetes operator that natively supports deployment practices for progressive delivery.
Installing the Argo Rollouts operator to your cluster
To install Argo Rollouts, follow the installation instructions. Essentially, you need a terminal with kubectl access to your cluster.
kubectl create namespace argo-rollouts
kubectl apply -n argo-rollouts -f https://raw.githubusercontent.com/argoproj/argo-rollouts/stable/manifests/install.yaml
You can optionally install the CLI locally, if you want to have more visibility in your deployments.
Blue/Green deployments
Blue/Green deployments are one of the simplest ways to minimize deployment downtime. Blue/Green deployments are not specific to Kubernetes, and can be used even for traditional applications that reside on Virtual Machines.
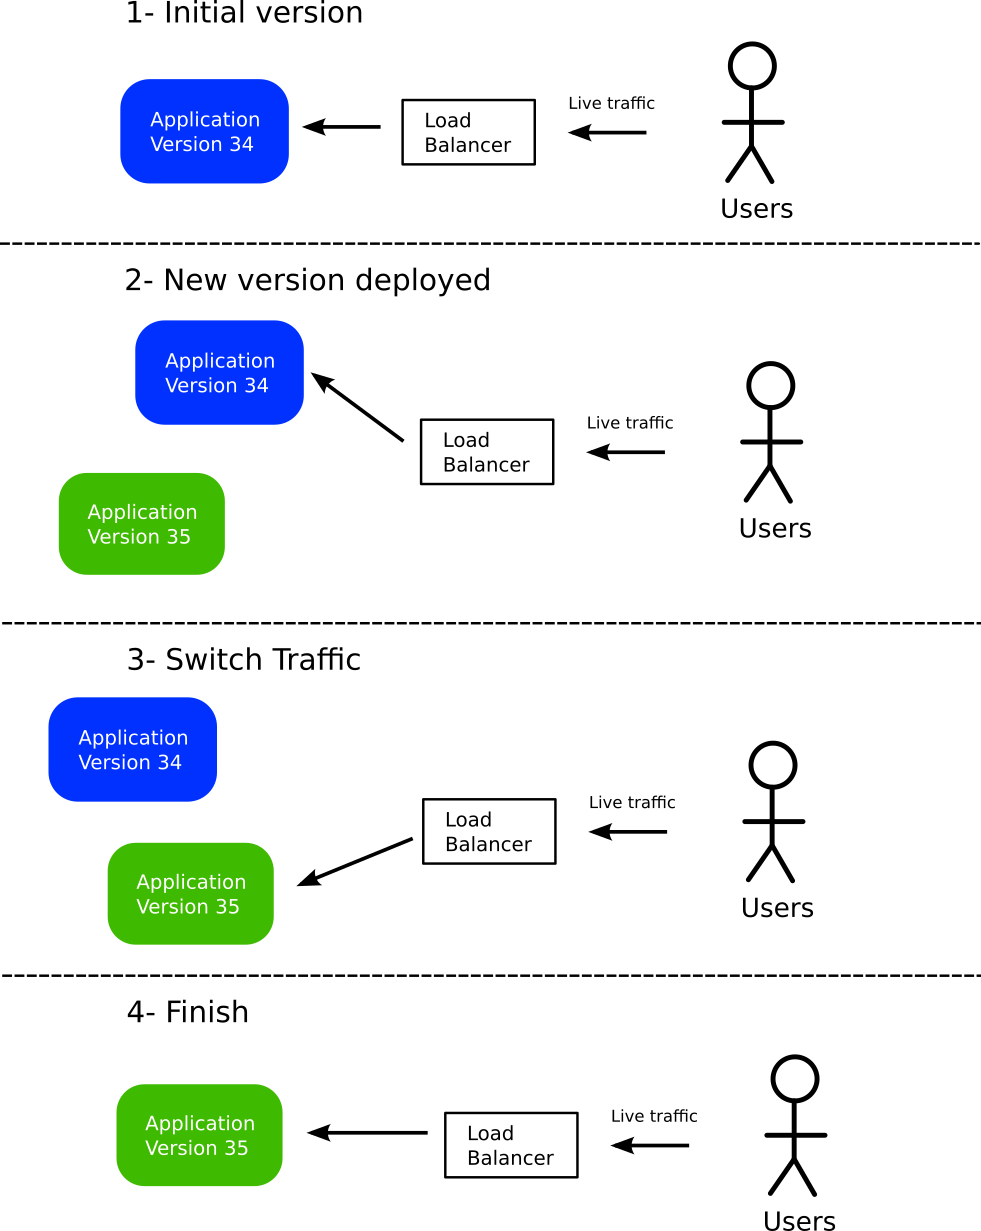
- At first all users of the application are routed to the current version (shown in blue). A key point is that all traffic passes from a load balancer.
- A new version is deployed (shown in green). As this version does not receive any live traffic, all users are still served by the previous/stable version.
- Developers can test internally the new green version, and verify its validity. If it is valid, traffic is switched to that new version.
- If everything goes well, the old version is completely discarded. We are back to the initial state (order of colors does not matter).
The major benefit of this pattern is that if at any point in time the new version has issues, all users can be switched back to the previous version (via the load balancer). Switching via the load balancer is much faster than redeploying a new version, resulting in minimum disruption for existing users.
There are several variations of this pattern. In some cases, the old color is never destroyed but keeps running in the background. You can also retain even older versions online, maybe with a smaller footprint, allowing for easy switching to any previous application revision.
Blue/Green Kubernetes Deployment with Argo Rollouts
Even though Argo Rollouts supports the basic blue/green pattern described in the previous section, it also offers a wealth of customization options.
One of the most important additions is the ability to “test” the upcoming color by introducing a “preview” Kubernetes service, in addition to the service used for live traffic.
This preview service can be used by the team that performs the deployment to verify the new version before actually switching the traffic.
Here is the initial state of a deployment. The example uses two pods (shown as xnsdx and jftql in the diagram).
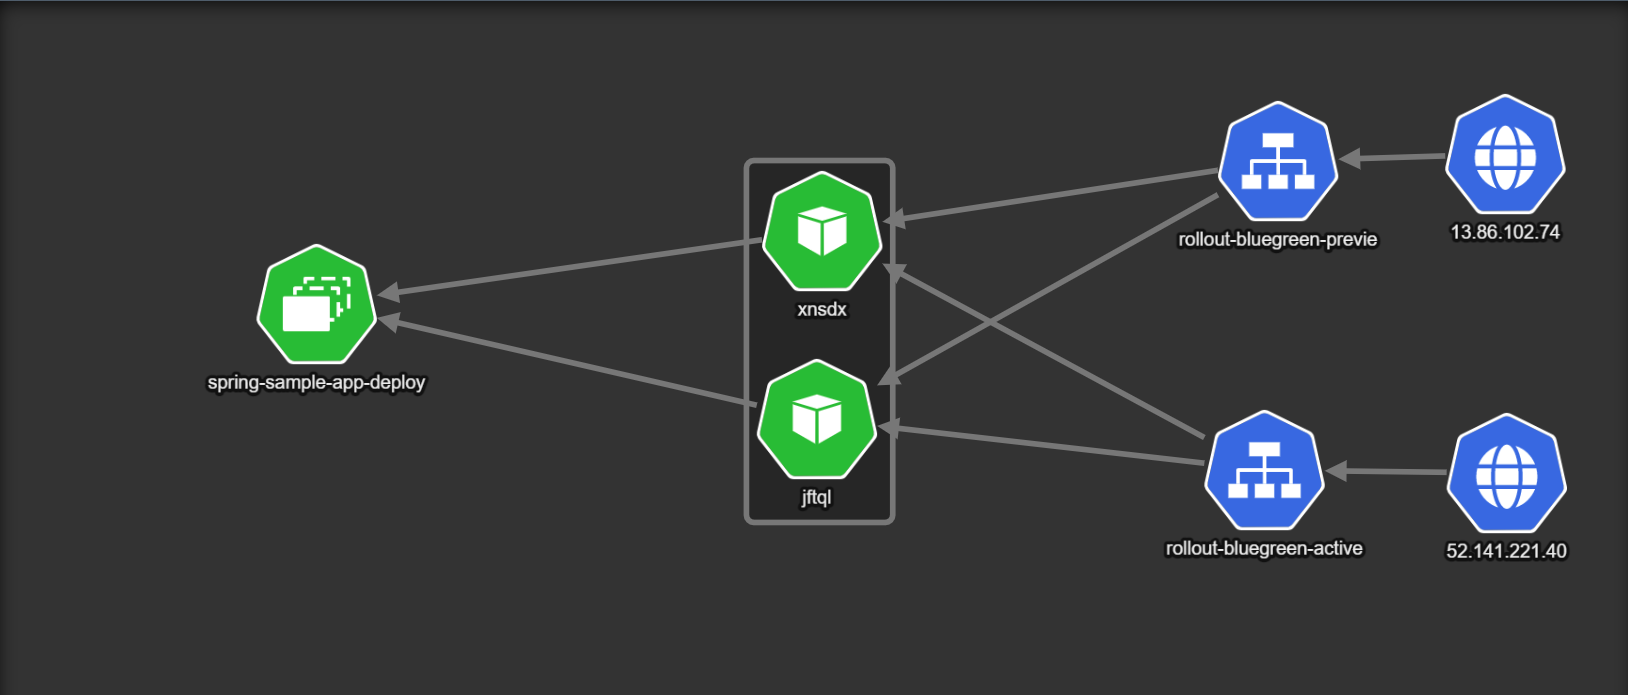
There are two Kubernetes services:
- A
rollout-blue-gree-activeservice that captures all live traffic from actual users of the application (internet traffic coming from51.141.221.40). - A secondary service called
rollout-bluegreen-preview. Under normal circumstances it also points to the same live version.
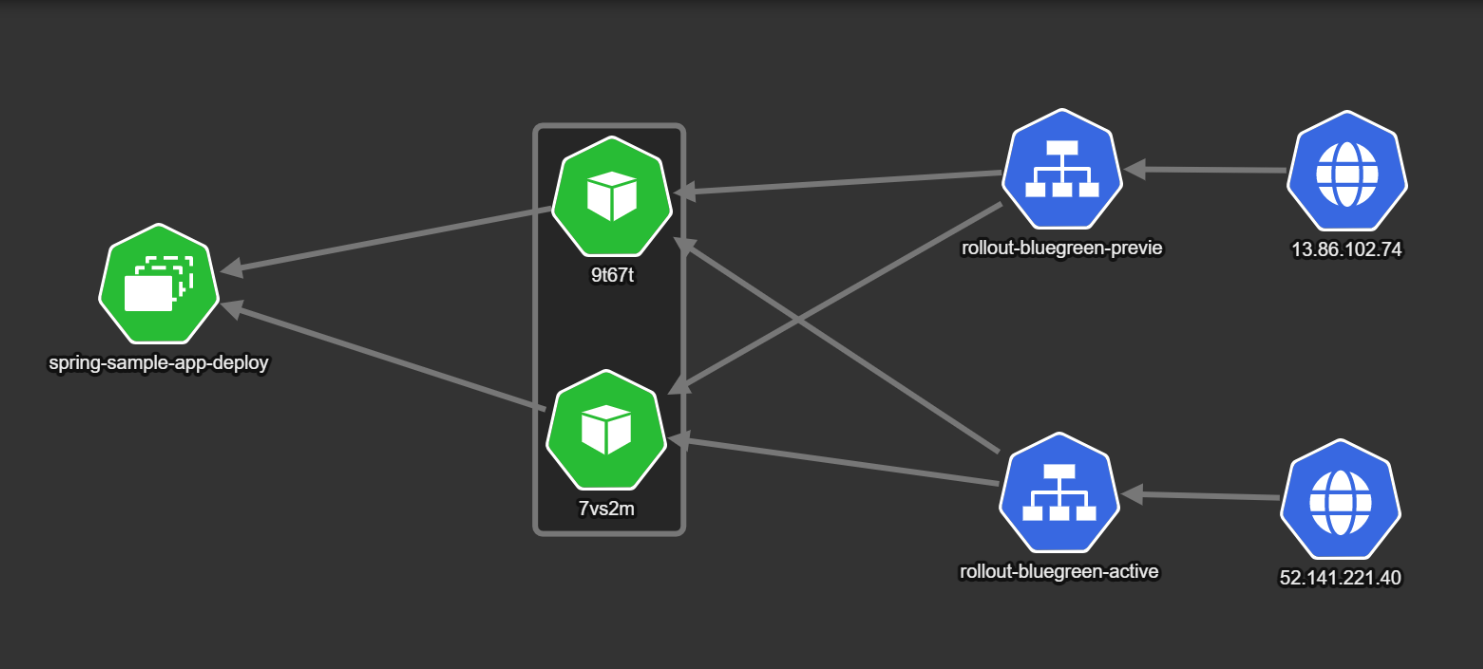
Once a deployment starts, a new “color” is created. In the example we have two new pods that represent the next version of the application to be deployed (shown as 9t67t and 7vs2m).
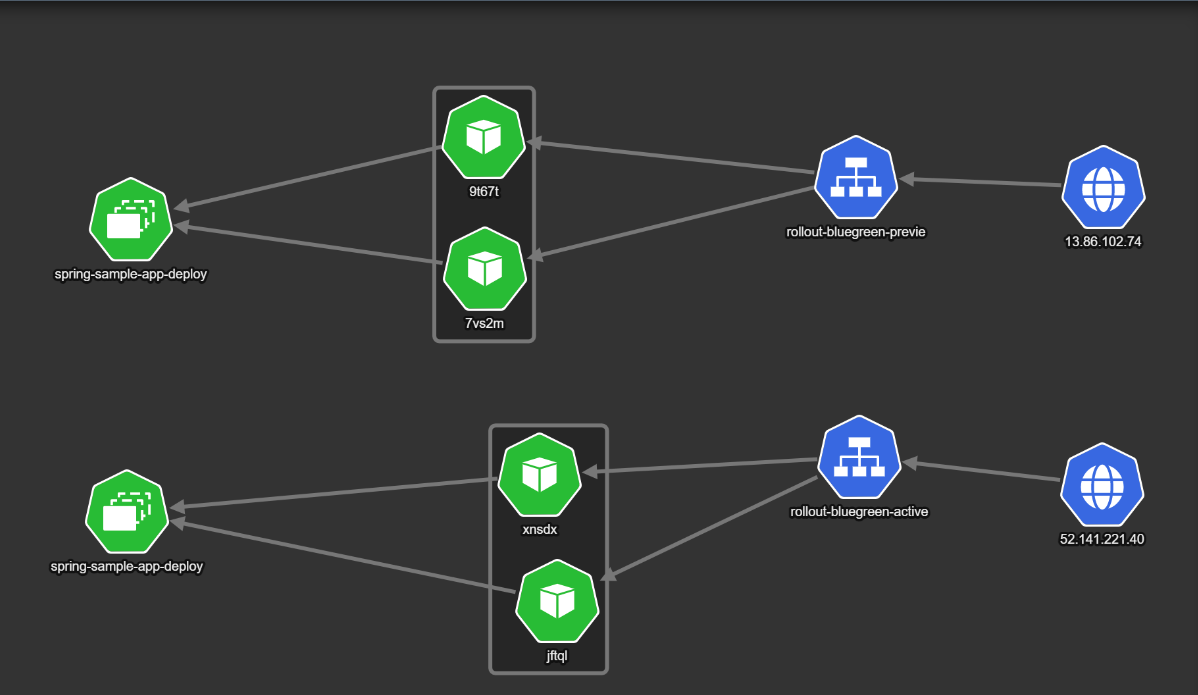
The important point here is the fact that the normal “active” service still points to the old version, while the “preview” service points to the new pods. This means that all active users are still on the old/stable deployment, while internal teams can use the “preview” service to test the new deployment.
If everything goes well, the next version is promoted to be the active version.
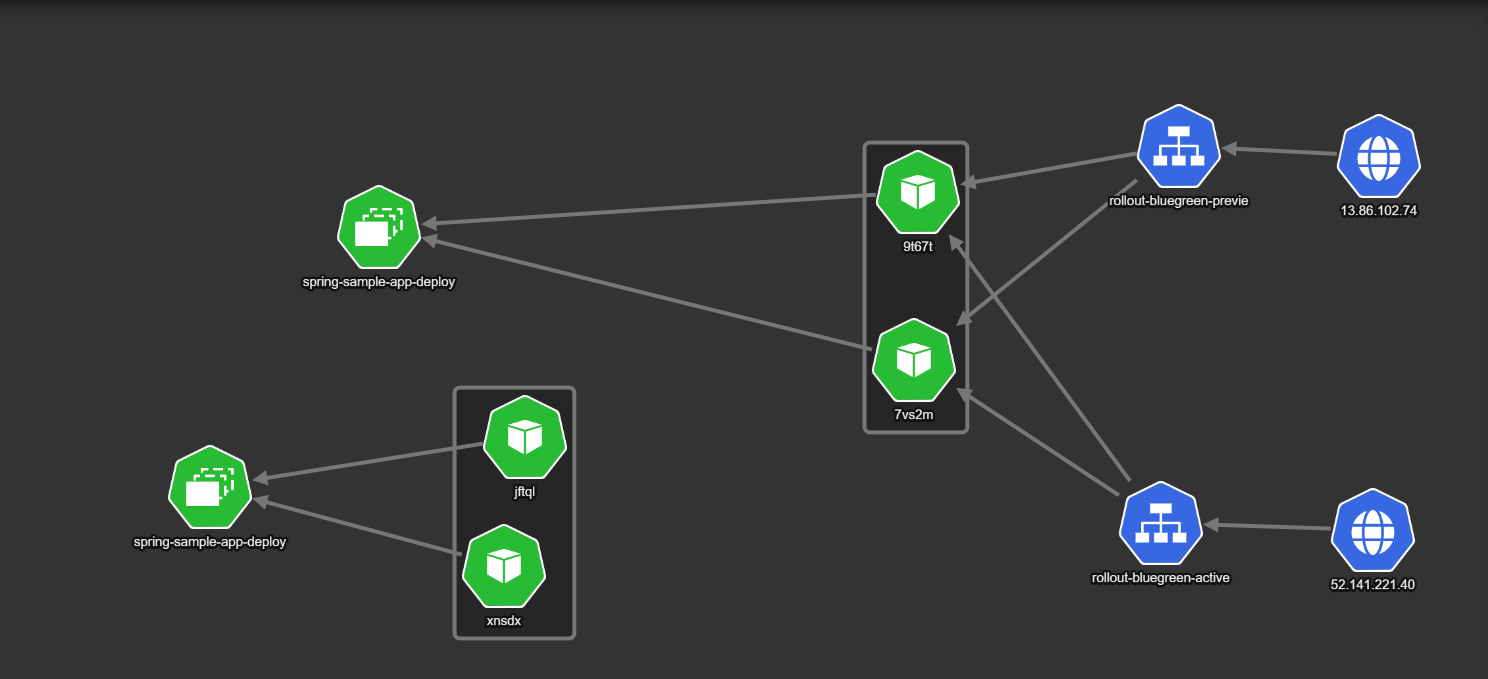
Here both services point to the new version. This is also the critical moment for all actual users of the application, as they are now switched to use the new version of the application. The old version is still around but no traffic is sent to it.
Having the old version around is a great failsafe, as one can abort the deployment process and switch back all active users to the old deployment in the fastest way possible.
After the configured duration, as defined in Argo Rollouts, the old version is scaled down completely to preserve resources. We are now back to the same configuration as the initial state, and the next deployment will follow the same sequence of events.
Example application
You can find an example application at https://github.com/codefresh-contrib/argo-rollout-blue-green-sample-app, that also includes simple integration tests.
Notice that the first deployment of your application will NOT follow the blue/green deployment process as there is no “previous” color. So you need to deploy it at least once.
git clone https://github.com/codefresh-contrib/argo-rollout-blue-green-sample-app.git
cd argo-rollout-blue-green-sample-app
kubectl create ns blue-green
kubectl apply -f ./blue-green-manual-approval -n blue-green
You can then monitor what Argo Rollouts is doing with the following command:
kubectl argo rollouts get rollout spring-sample-app-deployment --watch -n blue-green
Blue/Green deployment with manual approval
A quick way to use blue/green deployments is by simply inserting an approval step before the traffic switch step. This will pause the pipeline and the developers or QA can test the next version on their own before any live users are redirected to it.
Here is an example pipeline:
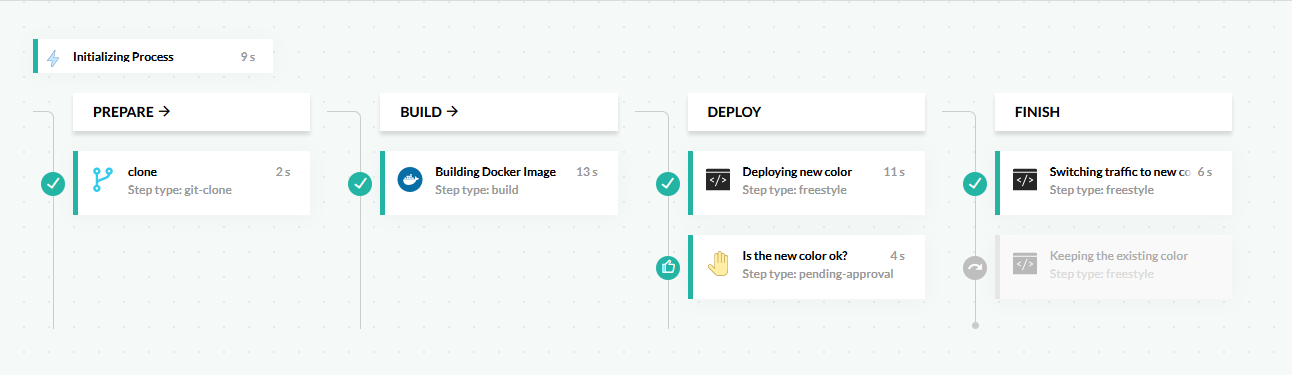
This pipeline does the following:
- Clones the source code of the application.
- Builds a Docker image.
- Deploys the application by updating the Kubernetes manifests. Argo Rollouts sees the new manifest, and creates a new “color” for the next version
- The pipeline is paused and waits for an approval/rejection by a human user.
- If the pipeline is approved, the new color is promoted, and becomes the new active version.
- If the pipeline is rejected, the new color is discarded, and all live users are not affected in any way.
Here is the pipeline definition:
codefresh.yml
version: "1.0"
stages:
  - prepare
  - build
  - deploy
  - finish
steps:
  clone:
    type: "git-clone"
    stage: prepare
    description: "Cloning main repository..."
    repo: '${{CF_REPO_OWNER}}/${{CF_REPO_NAME}}'
    revision: "${{CF_BRANCH}}"
  build_app_image:
    title: Building Docker Image
    type: build
    stage: build
    image_name: kostiscodefresh/argo-rollouts-blue-green-sample-app
    working_directory: "${{clone}}"
    tags:
    - "latest"
    - '${{CF_SHORT_REVISION}}'
    dockerfile: Dockerfile
  start_deployment:
    title: Deploying new color
    stage: deploy
    image: codefresh/cf-deploy-kubernetes:master
    working_directory: "${{clone}}"
    commands:
      - /cf-deploy-kubernetes ./blue-green-manual-approval/service.yaml
      - /cf-deploy-kubernetes ./blue-green-manual-approval/service-preview.yaml
      - /cf-deploy-kubernetes ./blue-green-manual-approval/rollout.yaml
    environment:
      - KUBECONTEXT=mydemoAkscluster@BizSpark Plus
      - KUBERNETES_NAMESPACE=blue-green
  wait_for_new_color:
    fail_fast: false
    type: pending-approval:1.0.2
    title: Is the new color ok?
    stage: deploy
  promote_color:
    title: Switching traffic to new color
    stage: finish
    image: kostiscodefresh/kubectl-argo-rollouts:latest
    commands:
      - /app/kubectl-argo-rollouts-linux-amd64 promote spring-sample-app-deployment -n blue-green --context "mydemoAkscluster@BizSpark Plus"
    when:
      steps:
      - name: wait_for_new_color
        on:
        - approved
  abort_deployment:
    title: Keeping the existing color
    stage: finish
    image: kostiscodefresh/kubectl-argo-rollouts:latest
    commands:
      - /app/kubectl-argo-rollouts-linux-amd64 undo spring-sample-app-deployment -n blue-green --context "mydemoAkscluster@BizSpark Plus"
    when:
      steps:
      - name: wait_for_new_color
        on:
        - denied
Just before the approval, you can optionally execute the Argo Rollouts CLI to see what is happening behind the scenes:
kubectl argo rollouts get rollout spring-sample-app-deployment --watch -n blue-green
It should show the new color come up, but not accepting any traffic.
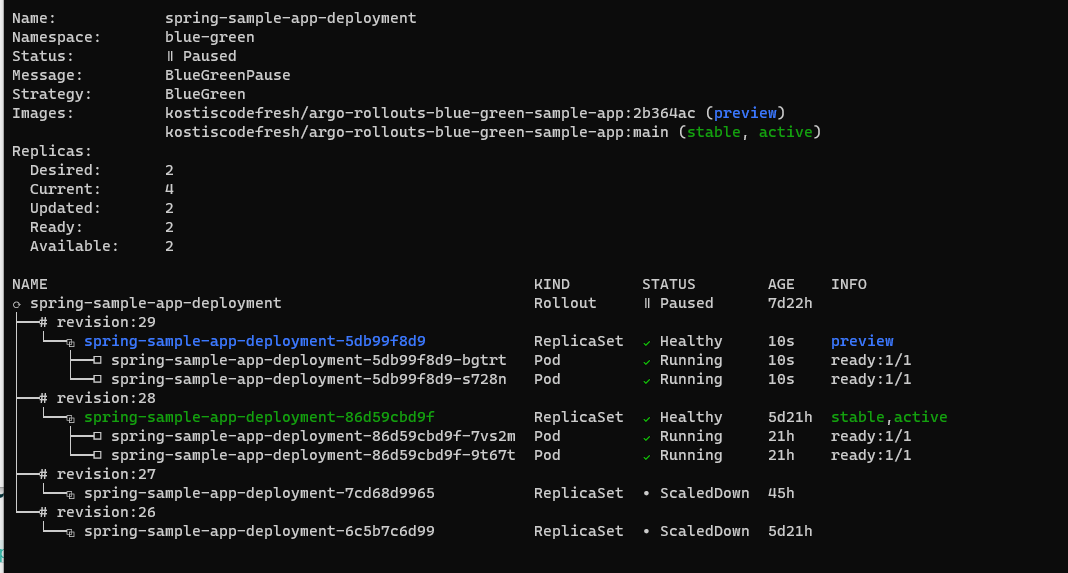
Once the deployment is complete, the old pods are destroyed after 30 seconds (this is the default value of Argo Rollouts).
Blue/Green deployment with smoke tests
Using manual approval before promoting the new version is a great starting point. To truly achieve continuous deployment, one should automate the testing process and eliminate the human approval.
There are many approaches on testing a release, and each organization will have a different set of “tests” that verify the next version of the software. Argo Rollouts has several integrations either with metric providers or simple Kubernetes jobs that can run integration tests or collect metrics and decide if the next color should be promoted or not.
Another alternative is to simply execute integration tests from within Codefresh. This is great if your integration tests need access to the source code or other external services that are accessible only to Codefresh.
We can modify the previous pipeline to include automated smoke tests that are already part of the example application.
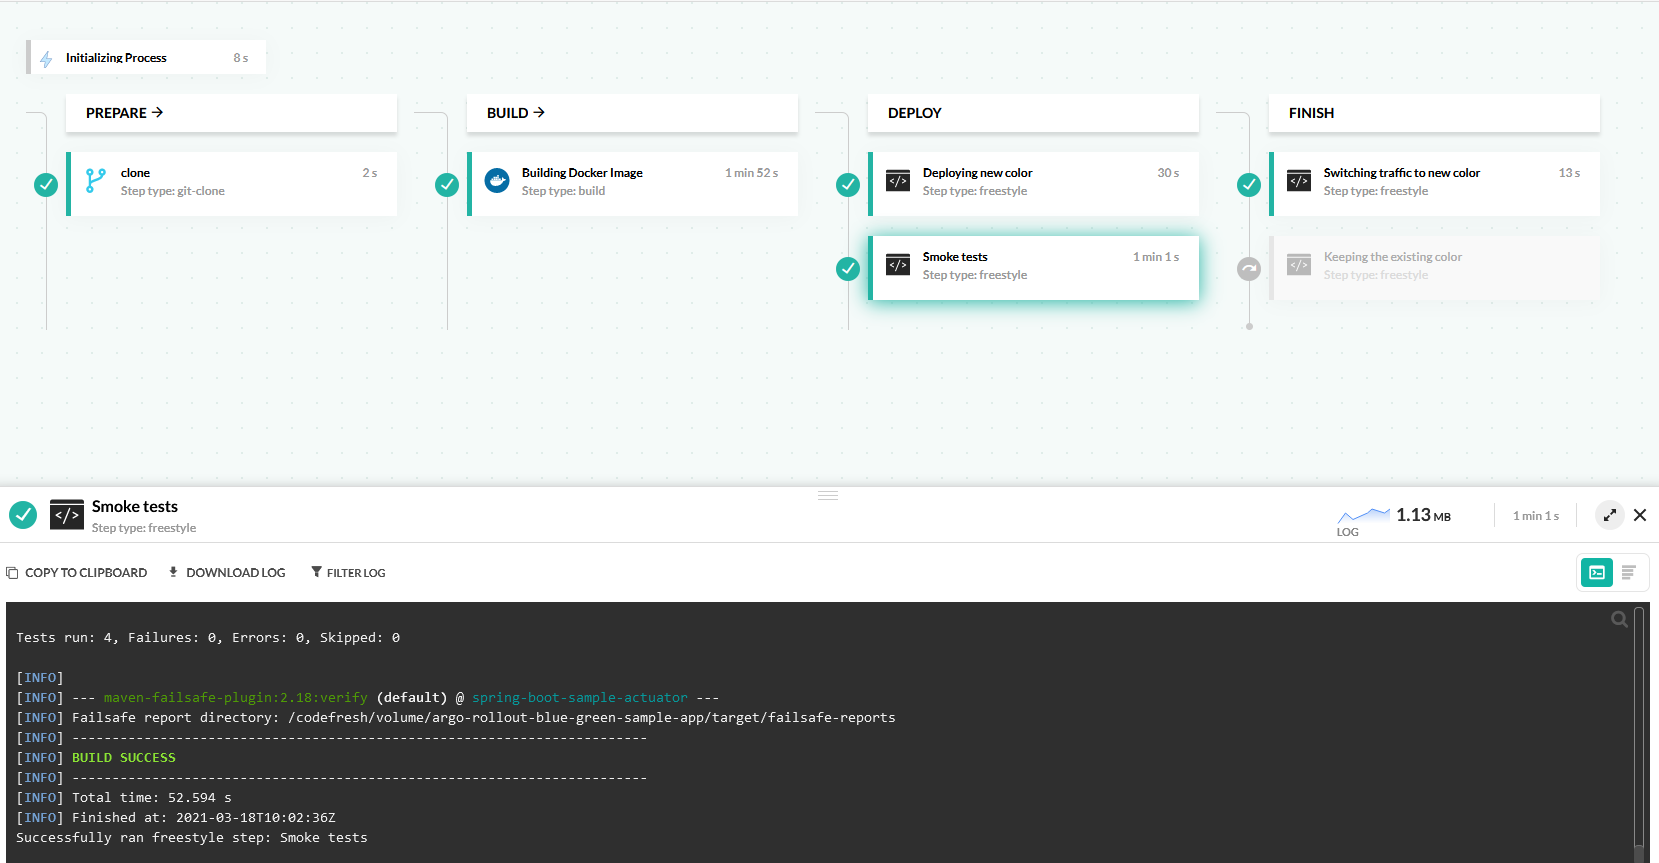
This pipeline does the following:
- Clones the source code of the application.
- Builds a Docker image.
- Deploys the application by updating the Kubernetes manifests. Argo Rollouts sees the new manifest and creates a new “color” for the next version.
- Runs integration tests against the “preview” service created by Argo Rollouts. Live users are still on the previous/stable version of the application.
- If smoke tests pass, the new color is promoted and becomes the new active version.
- If smoke tests fail, the new color is discarded and all live users are not affected in any way.
Here is the pipeline definition:
codefresh.yml
version: "1.0"
stages:
  - prepare
  - build
  - deploy
  - finish
steps:
  clone:
    type: "git-clone"
    stage: prepare
    description: "Cloning main repository..."
    repo: '${{CF_REPO_OWNER}}/${{CF_REPO_NAME}}'
    revision: "${{CF_BRANCH}}"
  build_app_image:
    title: Building Docker Image
    type: build
    stage: build
    image_name: kostiscodefresh/argo-rollouts-blue-green-sample-app
    working_directory: "${{clone}}"
    tags:
    - "latest"
    - '${{CF_SHORT_REVISION}}'
    dockerfile: Dockerfile
  start_deployment:
    title: Deploying new color
    stage: deploy
    image: codefresh/cf-deploy-kubernetes:master
    working_directory: "${{clone}}"
    commands:
      - /cf-deploy-kubernetes ./blue-green-manual-approval/service.yaml
      - /cf-deploy-kubernetes ./blue-green-manual-approval/service-preview.yaml
      - /cf-deploy-kubernetes ./blue-green-manual-approval/rollout.yaml
    environment:
      - KUBECONTEXT=mydemoAkscluster@BizSpark Plus
      - KUBERNETES_NAMESPACE=blue-green
  run_integration_tests:
    title: Smoke tests
    stage: deploy
    image: maven:3.5.2-jdk-8-alpine
    working_directory: "${{clone}}"
    fail_fast: false
    commands:
     - mvn -Dmaven.repo.local=/codefresh/volume/m2_repository verify -Dserver.host=http://13.86.102.74  -Dserver.port=80
  promote_color:
    title: Switching traffic to new color
    stage: finish
    image: kostiscodefresh/kubectl-argo-rollouts:latest
    commands:
      - /app/kubectl-argo-rollouts-linux-amd64 promote spring-sample-app-deployment -n blue-green --context "mydemoAkscluster@BizSpark Plus"
    when:
      steps:
      - name: run_integration_tests
        on:
        - success
  abort_deployment:
    title: Keeping the existing color
    stage: finish
    image: kostiscodefresh/kubectl-argo-rollouts:latest
    commands:
      - /app/kubectl-argo-rollouts-linux-amd64 undo spring-sample-app-deployment -n blue-green --context "mydemoAkscluster@BizSpark Plus"
    when:
      steps:
      - name: run_integration_tests
        on:
        - failure
You can optionally execute the Argo Rollouts CLI to see what is happening behind the scenes:
kubectl argo rollouts get rollout spring-sample-app-deployment --watch -n blue-green
For the sake of simplicity, we have hardcoded the load balancer for the preview service at 13.86.102.74. For an actual application, you would have a DNS name such as
preview.example.com, or use anotherkubectl commandto fetch the endpoint of the load balancer dynamically. Also, our integration tests assume that the application is already deployed, before they run. If your application takes too much time to deploy, you need to make sure that it is up before the tests actually run.
The end result is a continuous deployment pipeline, where all release candidates that don’t pass tests never reach production.
Canary deployments
Blue/Green deployments are great for minimizing downtime after a deployment, but they are not perfect. If your new version has a hidden issue that manifests itself only after some time (i.e. it is not detected by your smoke tests), then all your users will be affected, because the traffic switch is all or nothing.
An improved deployment method is canary deployments. These function similar to blue/green, but instead of switching 100% of live traffic all at once to the new version, you can instead move only a subset of users.
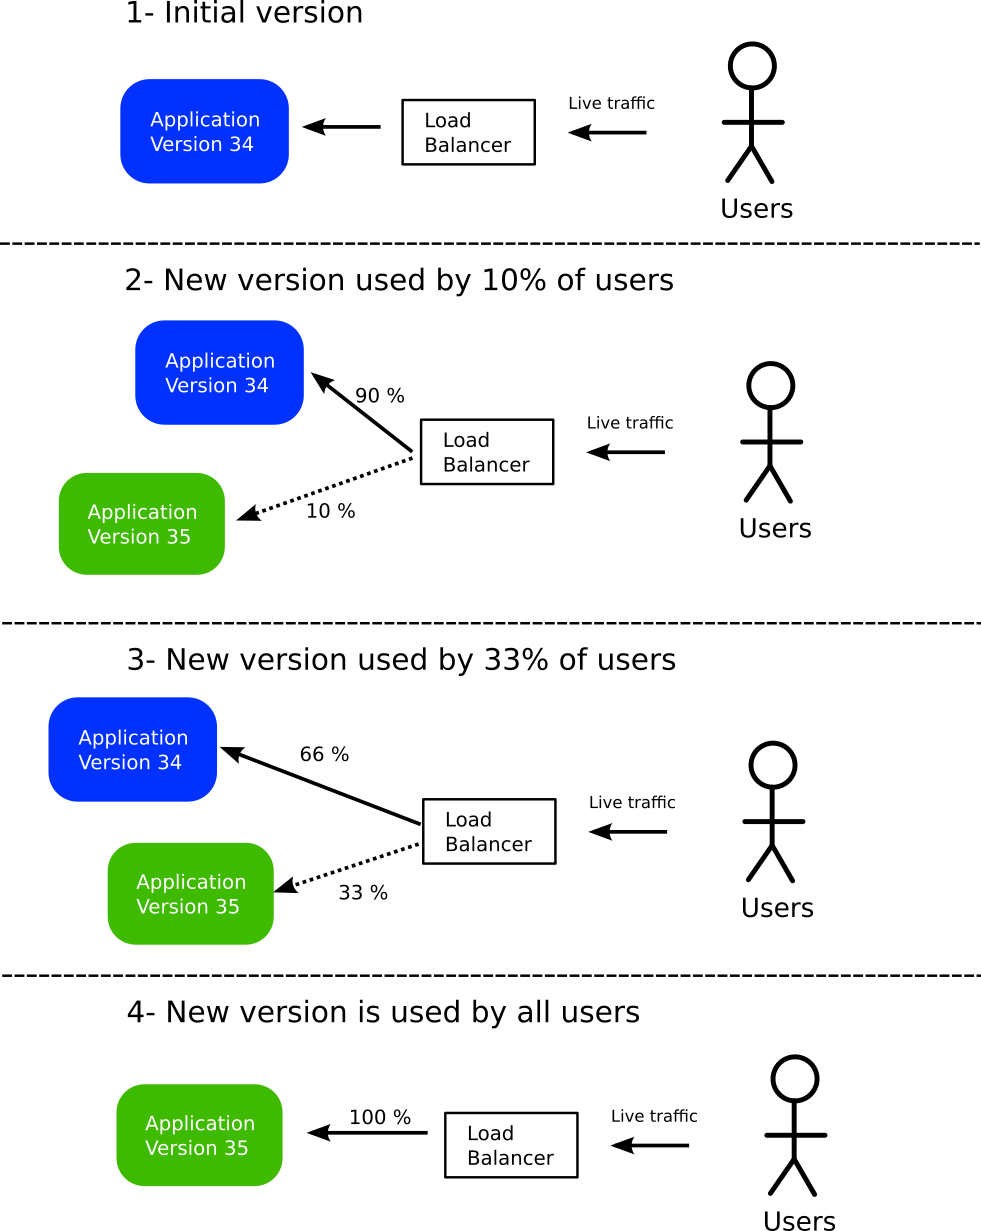
- At the start, all users of the application are routed to the current version (shown in blue). A key point is that all traffic passes from a load balancer.
- A new version is deployed (shown in green). This version gets only a very small amount of live traffic (for example 10%).
- Developers can test internally and monitor their metrics to verify the new release. If they are confident, they can redirect more traffic to the new version (for example 33%).
- If everything goes well, the old version is completely discarded. All traffic is now redirected to the new version. We are back to initial state (order of colors does not matter).
The major benefit of this pattern is that if at any point in time the new version has issues, only a small subset of live users are affected. And like blue/green deployments, performing a rollback is as easy as resetting the load balancer to send no traffic to the canary version. Switching the load balancer is much faster than redeploying a new version, resulting in minimum disruption for existing users.
There are several variations of this pattern. The amount of live traffic that you send to the canary at each step as well as the number of steps are user configurable. A simple approach would have just two steps (10%, 100%), while a more complex one could move traffic in a gradual way (10%, 30%, 60%, 90%, 100%).
Canary deployments are more advanced than blue/green deployments, and are also more complex to set up. The load balancer is now much smarter as it can handle two streams of traffic at the same time with different destinations of different weights. You also need a way (usually an API) to instruct the loadbalancer to change the weight distribution of the traffic streams. If you are just getting started with progressive delivery, we suggest you master blue/green deployments first, before adopting canaries.
Canary Deployment with Argo Rollouts
Argo Rollouts supports the basic canary pattern described in the previous section, and also offers a wealth of customization options.
One of the most important
additions is the ability to “test” the upcoming version by introducing a “preview” Kubernetes service, in addition to the service used for live traffic.
This preview service can be used by the team that performs the deployment to verify the new version as it gets used by the subset of live users.
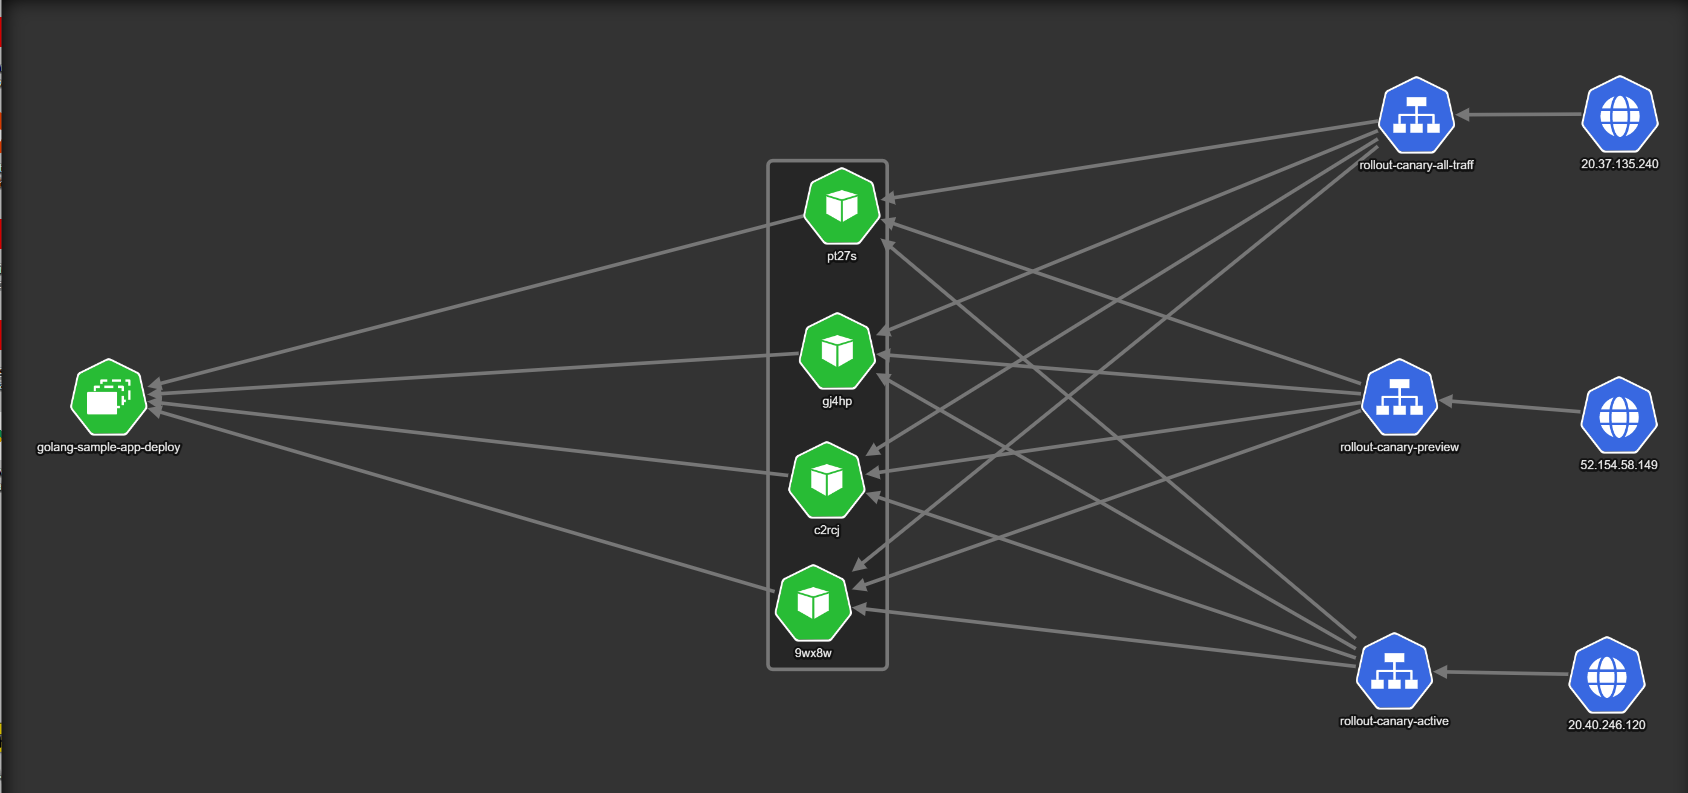
Here is the initial state of a deployment. The example uses four pods (shown as 22nqx, nqksq, 8bzwh and jtdcc in the diagram).
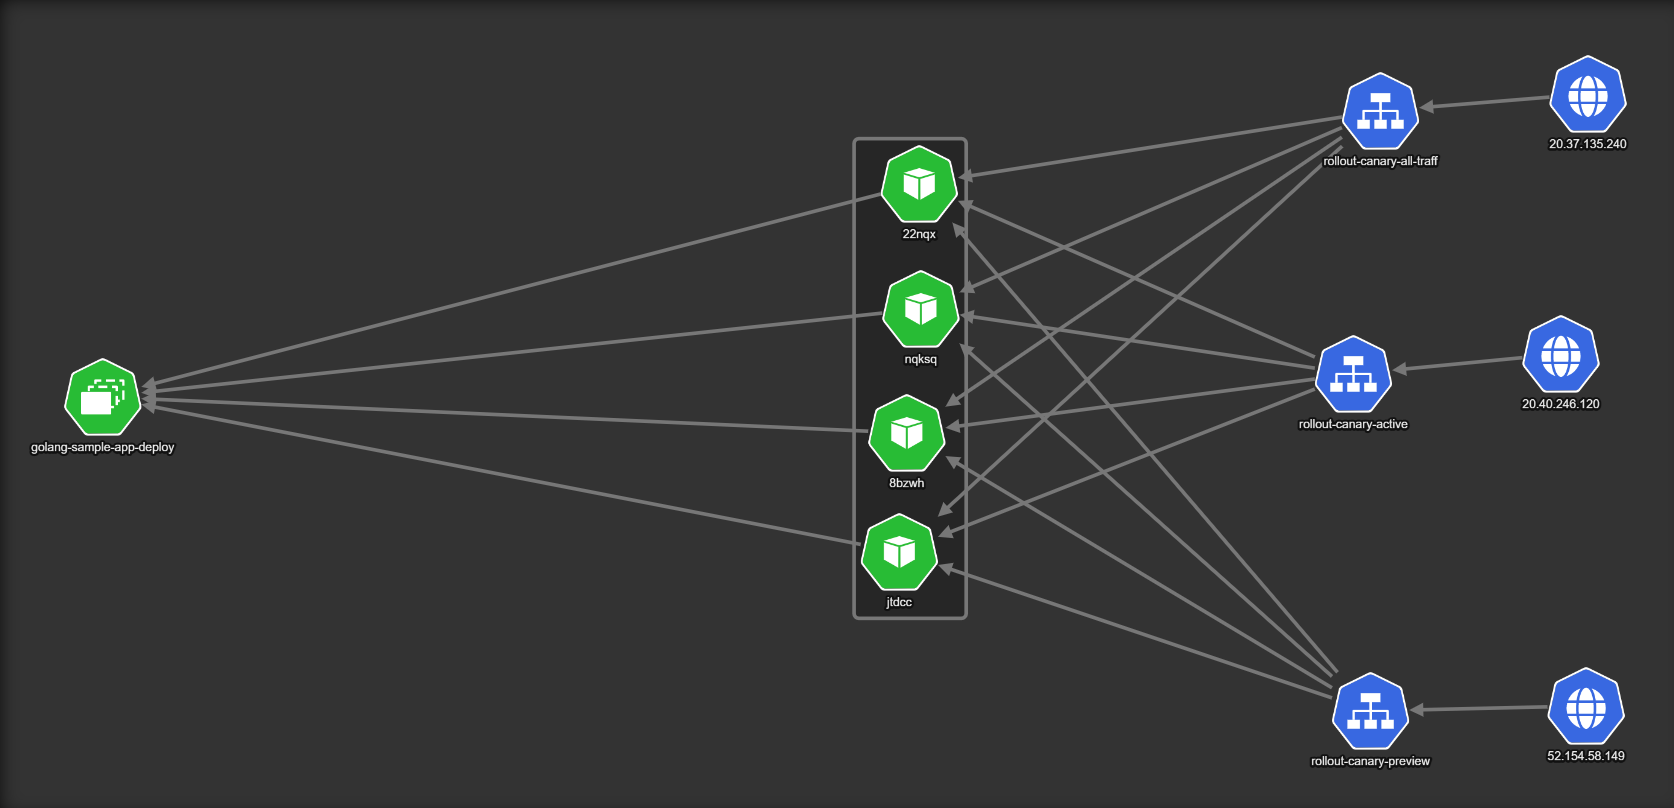
There are now three Kubernetes services:
- The
rollout-canary-all-trafficthat captures all live traffic from actual users of the application (internet traffic coming from20.37.135.240). - A secondary service,
rollout-canary-active, that always points to the stable/previous version of the software. - A third service,
rollout-canary-preview, that only routes traffic to the canary/new versions.
In normal circumstances all there services point to the same version.
Once a deployment starts, a new “version” is created. In the example we have one new pod that represents the next version of the application to be deployed (shown as 9wx8w at the top of the diagram).
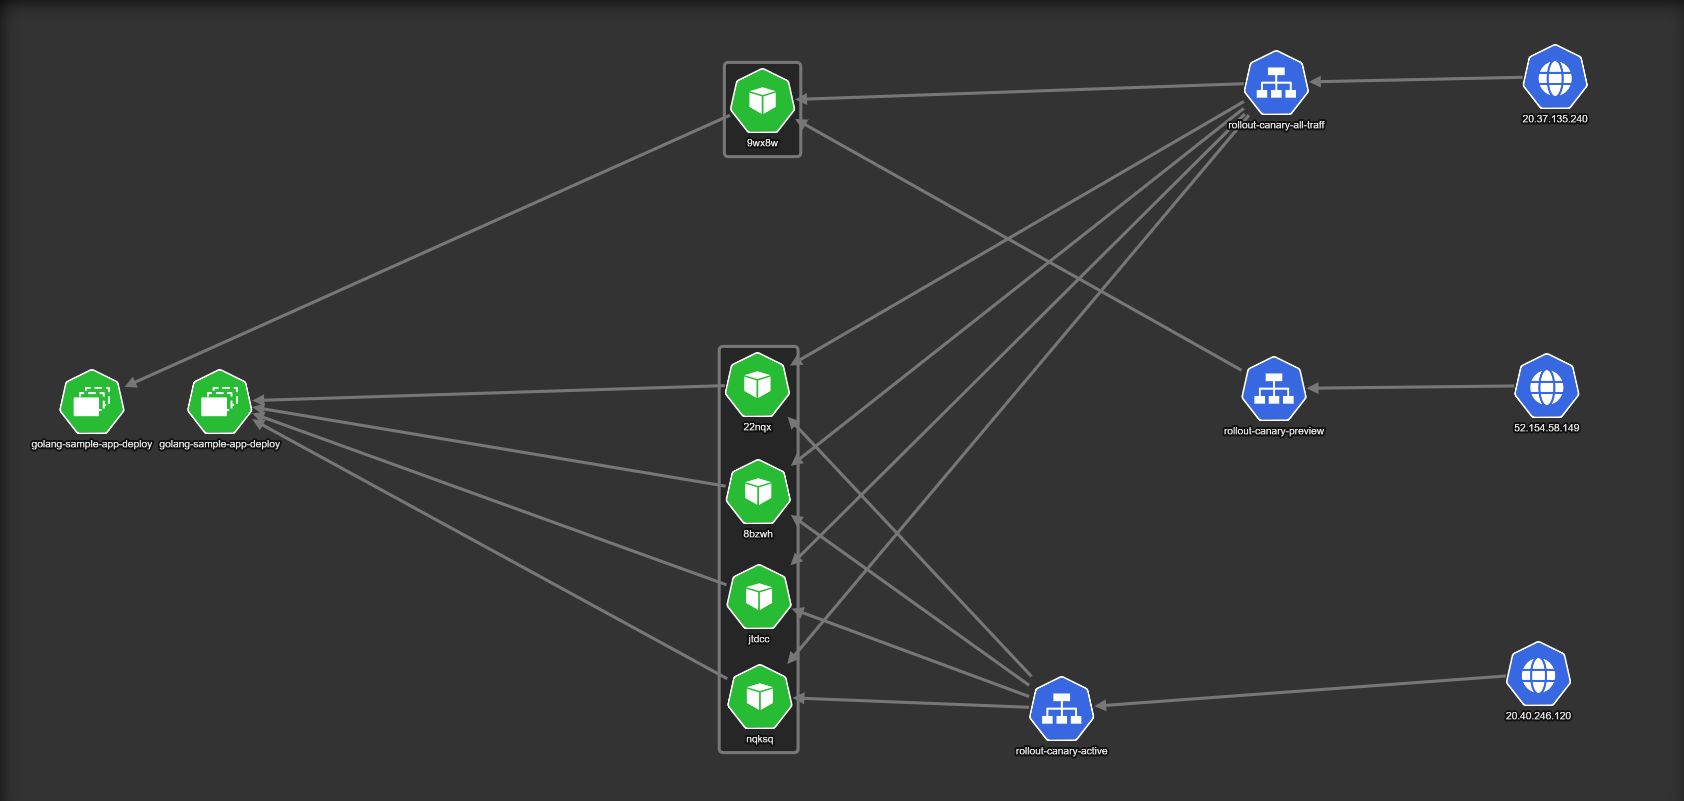
The important point here is the fact that the service used by live users (called rollout-canary-all-traffic) routes traffic to both the canary and the previous version. It is not visible in the diagram, but only 10% of traffic is sent to the single pod that hosts the new version, while 90% of traffic goes to the four pods of the old version.
The rollout-canary-preview service goes only to the canary pod. You can use this service to examine metrics from the canary or even give it to users who always want to try the new version first (e.g. your internal developers). On the other hand, the rollout-canary-active service always goes to the stable version. You can use that for users who never want to try the new version first or for verifying how something worked in the previous version.
If everything goes well, and you are happy with how the canary works, we can redirect some more traffic to it.
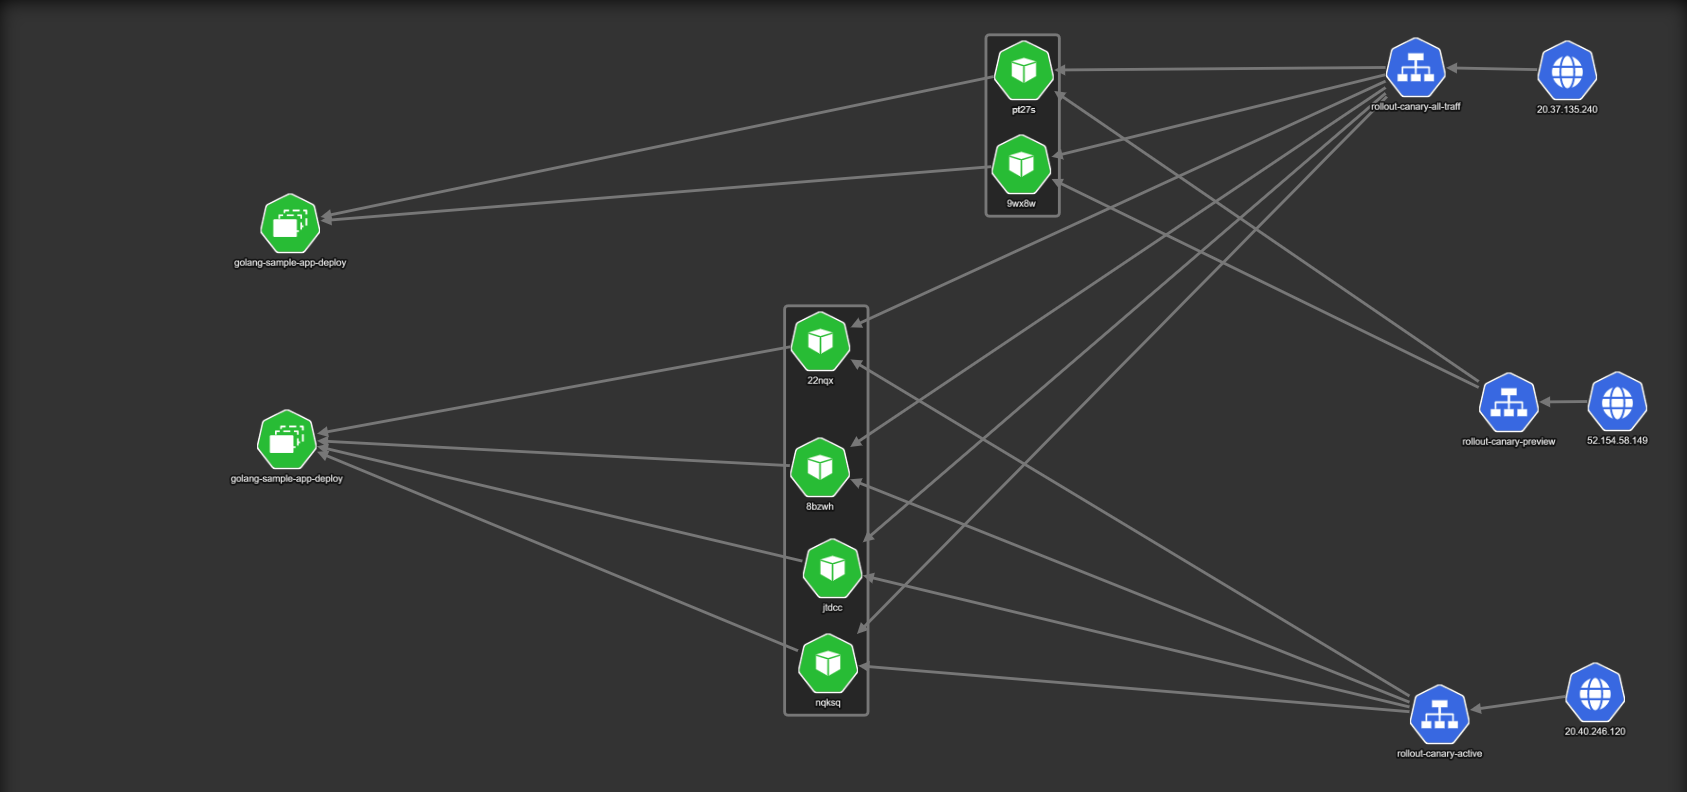
We are now sending 33% of live traffic to the canary (the traffic weights are not visible in the picture). To accommodate the extra traffic, the canary version now has two pods instead of one. This is also another great feature of Argo Rollouts. The amount of pods you have in the canary is completely unrelated to the amount of traffic that you send to it. You can have all possible combinations that you can think of (e.g. 10% of traffic to five pods, or 50% of traffic to three pods and so on). It all depends on the resources used by your application.
It makes sense of course to gradually increase the number of pods in the canary as you shift more traffic to it.
Having the old version around is a great failsafe, as one can abort the deployment process and switch back all active users to the old deployment in the fastest way possible by simply telling the load balancer to move 100% of traffic back to the previous version.
Two more pods are launched for the canary (for a total of four), and finally we can shift 100% of live traffic to it. After some time,the old version is scaled down completely to preserve resources. We are now back to the same configuration as the initial state, and the next deployment will follow the same sequence of events.
Example application
You can find an example application at https://github.com/codefresh-contrib/argo-rollout-canary-sample-app that also includes simple metrics (we will use them in the second example with canaries).
Notice that the first deployment of your application will NOT follow the canary deployment process as there is no “previous” version. So you need to deploy it at least once.
git clone https://github.com/codefresh-contrib/argo-rollout-canary-sample-app.git
cd argo-rollout-canary-sample-app
kubectl create ns canary
kubectl apply -f ./canary-manual-approval -n canary
You can then monitor what argo rollouts is doing with the following command:
kubectl argo rollouts get rollout golang-sample-app-deployment --watch -n canary
Choosing a solution for Traffic Management
Unlike Blue/Green deployments, canary deployments require a smarter way to handle incoming traffic to your application. Specifically for Kubernetes, you need a networking solution that can split traffic according to percentages. Kubernetes on its own performs simple load balancing where the number of pods affects the traffic they get. But that is not enough for canary deployments.
Argo Rollouts has several integrations with Service Meshes and ingresses that can be used for Traffic Splits.
Apart from the platforms that are supported natively by Argo Rollouts, you can also use any solution that implements the Service Mesh Interface (SMI), a common standard for service mesh implementations. Argo Rollouts adheres to the SMI spec, and can instruct any compliant solution for the traffic split process during canaries.
In our example we are using LinkerD, an open source service mesh solution for Kubernetes that also implements SMI. You can install LinkerD by following the official documentation in your cluster and then making sure that your application is meshed (i.e. it is managed by LinkerD) by adding the special annotation linkerd.io/inject:enabled in the rollout YAML.
Canary deployment with manual approval
As with Blue/Green deployments, the easiest way to use canaries is by simply inserting an approval step before each subsequent traffic switch step. This will pause the pipeline and the developers or QA team can evaluate the canary stability.
Here is the Canary setup:
rollout.yaml (excerpt)
spec:
  replicas: 4
  strategy:
    canary:
      canaryService: rollout-canary-preview
      stableService: rollout-canary-active
      trafficRouting:
        smi:
          trafficSplitName: rollout-example-traffic-split
          rootService: rollout-canary-all-traffic
      steps:
        - setWeight: 10
        - setCanaryScale:
            weight: 25
        - pause: {}
        - setWeight: 33
        - setCanaryScale:
            weight: 50
        - pause: {}
The canary has essentially three stages. At the beginning, it gets only 10% of the traffic and then it stops. At this point it creates 1/4 of pods. Then if we promote it, it gets 33% of the traffic and is now scaled up to 1/2 the number of pods constituting a full deployment. We pause again and then finally it gets 100% of live traffic.
Here is the pipeline with canary steps:
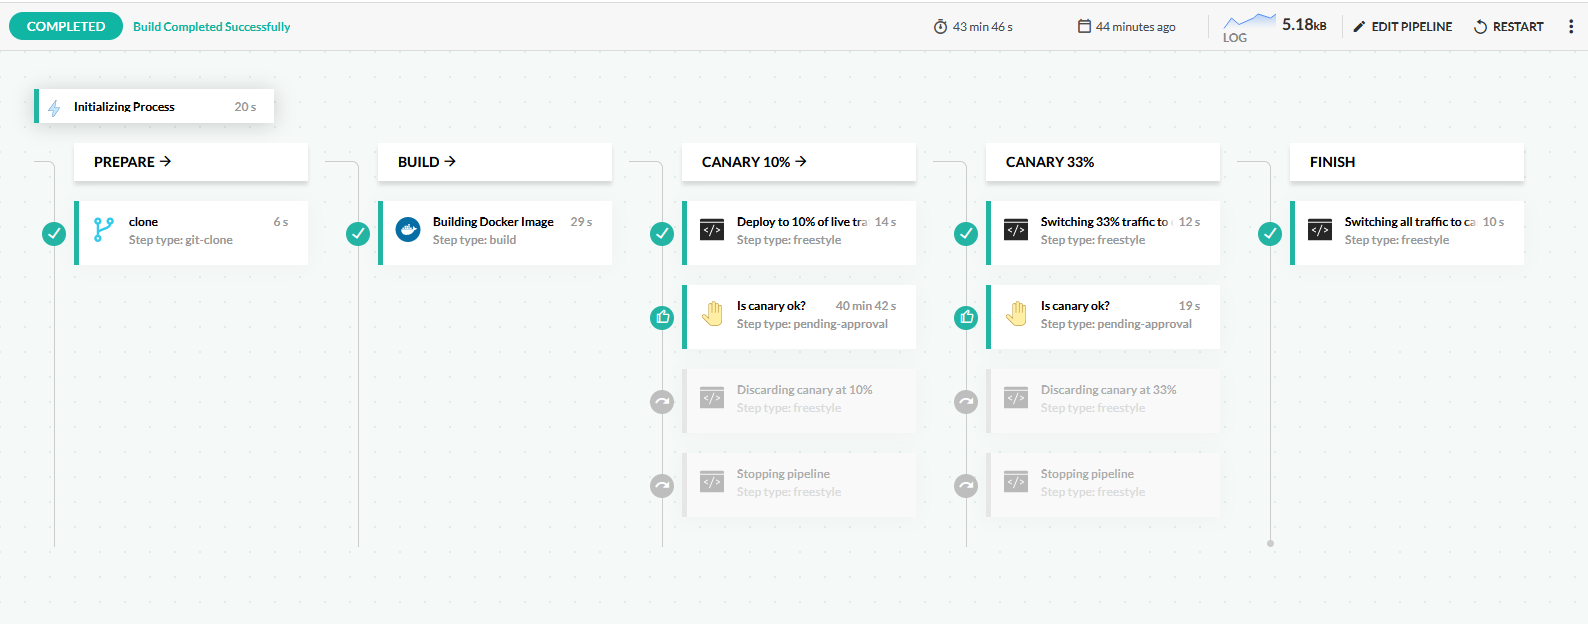
This pipeline does the following:
- Clones the source code of the application.
- Builds a Docker image.
- Deploys the application by updating the Kubernetes manifests. Argo Rollouts sees the new manifest and creates a new version. 10% of live traffic is redirected to it.
- The pipeline is paused and waits for an approval/rejection by a human user.
- If the pipeline is approved, 33% of traffic is now sent to the canary. If the pipeline is rejected, the canary is discarded and all traffic goes back to the stable version.
- In the next pause, the pipeline waits for a second approval.
- If the pipeline is approved, all traffic is now sent to the canary. If the pipeline is rejected, the canary is discarded and all traffic goes back to the stable version.
Here is the pipeline definition:
codefresh.yml
version: "1.0"
stages:
  - prepare
  - build
  - 'canary 10%'
  - 'canary 33%'
  - finish
steps:
  clone:
    type: "git-clone"
    stage: prepare
    description: "Cloning main repository..."
    repo: '${{CF_REPO_OWNER}}/${{CF_REPO_NAME}}'
    revision: "${{CF_BRANCH}}"
  build_app_image:
    title: Building Docker Image
    type: build
    stage: build
    image_name: kostiscodefresh/argo-rollouts-canary-sample-app
    working_directory: "${{clone}}"
    tags:
    - "latest"
    - '${{CF_SHORT_REVISION}}'
    dockerfile: Dockerfile
  start_deployment:
    title: Deploy to 10% of live traffic
    stage: 'canary 10%'
    image: codefresh/cf-deploy-kubernetes:master
    working_directory: "${{clone}}"
    commands:
      - /cf-deploy-kubernetes ./canary-manual-approval/service.yaml
      - /cf-deploy-kubernetes ./canary-manual-approval/service-preview.yaml
      - /cf-deploy-kubernetes ./canary-manual-approval/service-all.yaml
      - /cf-deploy-kubernetes ./canary-manual-approval/rollout.yaml
    environment:
      - KUBECONTEXT=mydemoAkscluster@BizSpark Plus
      - KUBERNETES_NAMESPACE=canary
  check_canary_10:
    fail_fast: false
    type: pending-approval:1.0.2
    title: Is canary ok?
    stage: 'canary 10%'
  promote_canary_33:
    title: Switching 33% traffic to canary
    stage: 'canary 33%'
    image: kostiscodefresh/kubectl-argo-rollouts:latest
    commands:
      - /app/kubectl-argo-rollouts-linux-amd64 promote golang-sample-app-deployment -n canary --context "mydemoAkscluster@BizSpark Plus"
    when:
      steps:
      - name: check_canary_10
        on:
        - approved
  abort_deployment_10:
    title: Discarding canary at 10%
    stage: 'canary 10%'
    image: kostiscodefresh/kubectl-argo-rollouts:latest
    commands:
      - /app/kubectl-argo-rollouts-linux-amd64 undo golang-sample-app-deployment -n canary --context "mydemoAkscluster@BizSpark Plus"
    when:
      steps:
      - name: check_canary_10
        on:
        - denied
  exit_10:
    title: Stopping pipeline
    stage: 'canary 10%'
    image: alpine:39
    commands:
      - echo "Canary failed"
      - exit 1
    when:
      steps:
      - name: check_canary_10
        on:
        - denied
  check_canary_33:
    fail_fast: false
    type: pending-approval:1.0.2
    title: Is canary ok?
    stage: 'canary 33%'
  promote_canary_full:
    title: Switching all traffic to canary
    stage: finish
    image: kostiscodefresh/kubectl-argo-rollouts:latest
    commands:
      - /app/kubectl-argo-rollouts-linux-amd64 promote golang-sample-app-deployment -n canary --context "mydemoAkscluster@BizSpark Plus"
    when:
      steps:
      - name: check_canary_33
        on:
        - approved
  abort_deployment_33:
    title: Discarding canary at 33%
    stage: 'canary 33%'
    image: kostiscodefresh/kubectl-argo-rollouts:latest
    commands:
      - /app/kubectl-argo-rollouts-linux-amd64 undo golang-sample-app-deployment -n canary --context "mydemoAkscluster@BizSpark Plus"
    when:
      steps:
      - name: check_canary_33
        on:
        - denied
  exit_33:
    title: Stopping pipeline
    stage: 'canary 33%'
    image: alpine:39
    commands:
      - echo "Canary failed"
      - exit 1
    when:
      steps:
      - name: check_canary_33
        on:
        - denied
Just before the approval, you can optionally execute the Argo Rollouts CLI to see what is happening behind the scenes:
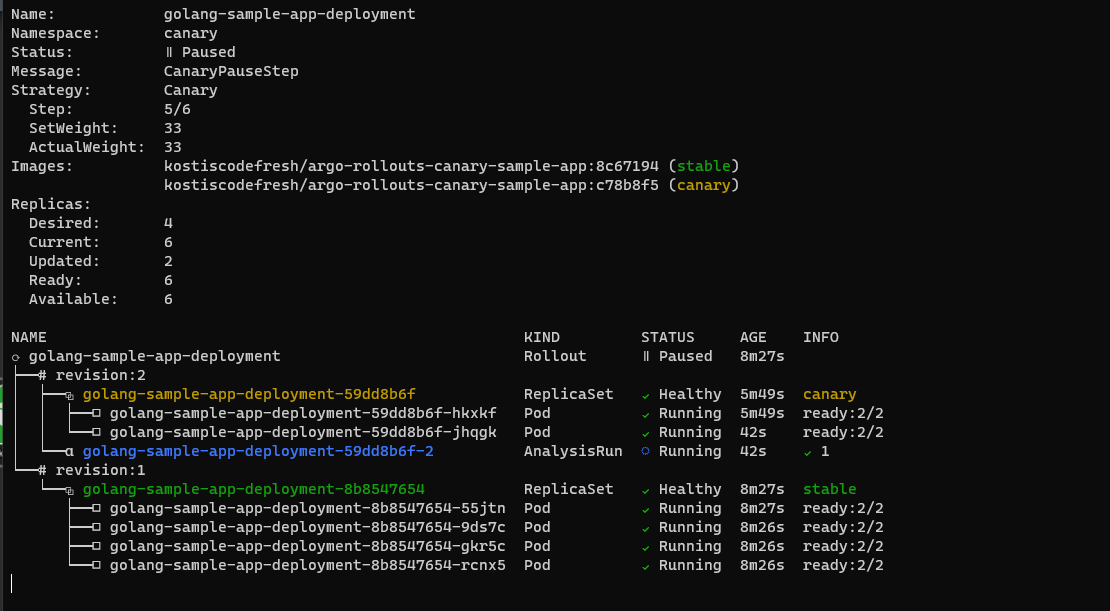
kubectl argo rollouts get rollout golang-sample-app-deployment --watch -n canary
It should show the status of the canary pods with amount of traffic that is redirected to it.
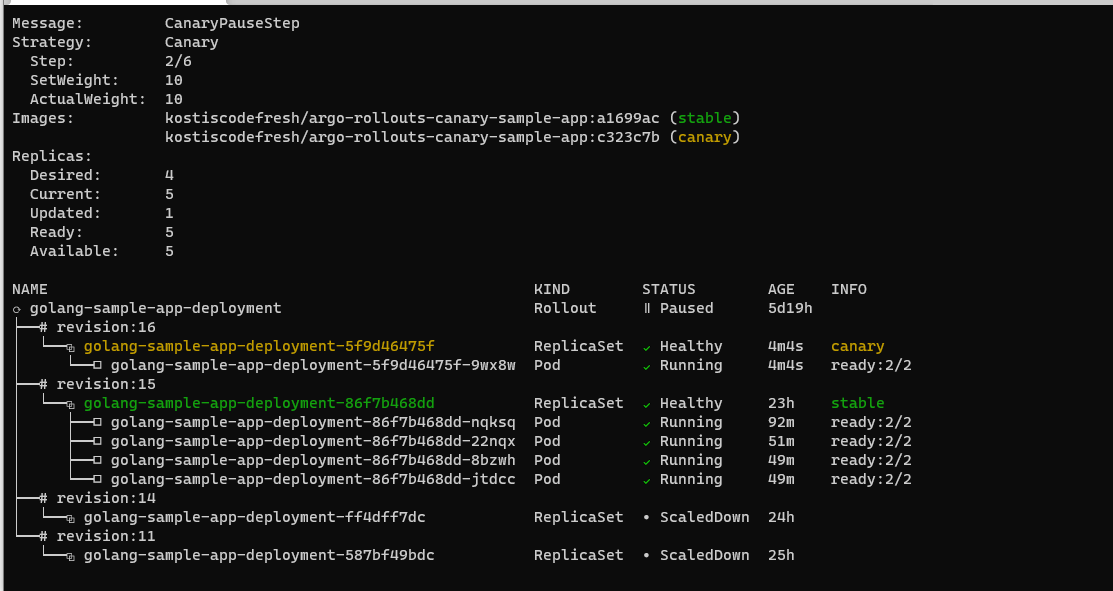
In the above picture, the canary deployment has just started. There is only one pod for the canary that gets 10% of live traffic. The four pods of the previous version still receive 90% percent of live traffic.
You can also see the traffic split in the LinkerD Dashboard:
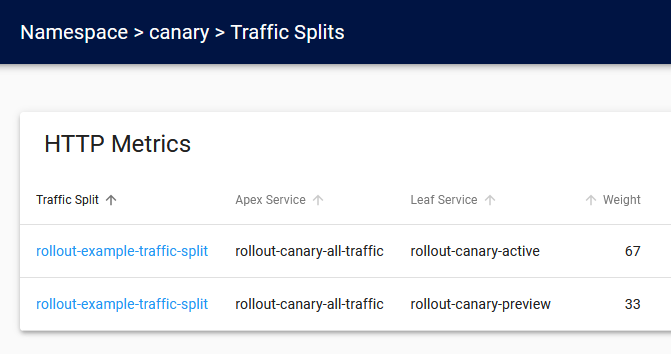
The screenshot above is from the second stage of the canary where 33% of live traffic is redirected to the canary pods.
You can also get the same information from the command line with kubectl get trafficsplit.
Choosing a solution for automated metric analysis
Canary deployments with manual pauses are great to get started but can quickly become cumbersome and error-prone. Ideally, the canary should automatically promote itself if the application “looks good”. One of the most straightforward ways to examine application health is by reading its metrics and decide on the progress of the canary in a completely automated way.
There are two main sources for metrics that you can use
- Application-specific metrics. This requires instrumentation in your application but is very powerful as you can query exactly what you want.
- Cluster-level metrics (i.e. from the service mesh). These are very easy to set up, but are generic and deal mostly with the traffic the application receives.
Argo Rollouts has native integration for several metric providers. We will use Prometheus in our example. The example application is already instrumented to expose some basic metrics.
First, you need to install Prometheus by following the official documentation. Then you need to make sure that Prometheus will actually scrape your application. Prometheus has native service discovery for Kubernetes but you need to enable it in the configuration.
If you install Prometheus with the Helm chart, Kubernetes service discovery is already enabled. The only thing to set up is to add the prometheus.io/scrape: "true" annotation in your rollout so that Prometheus does not ignore your application.
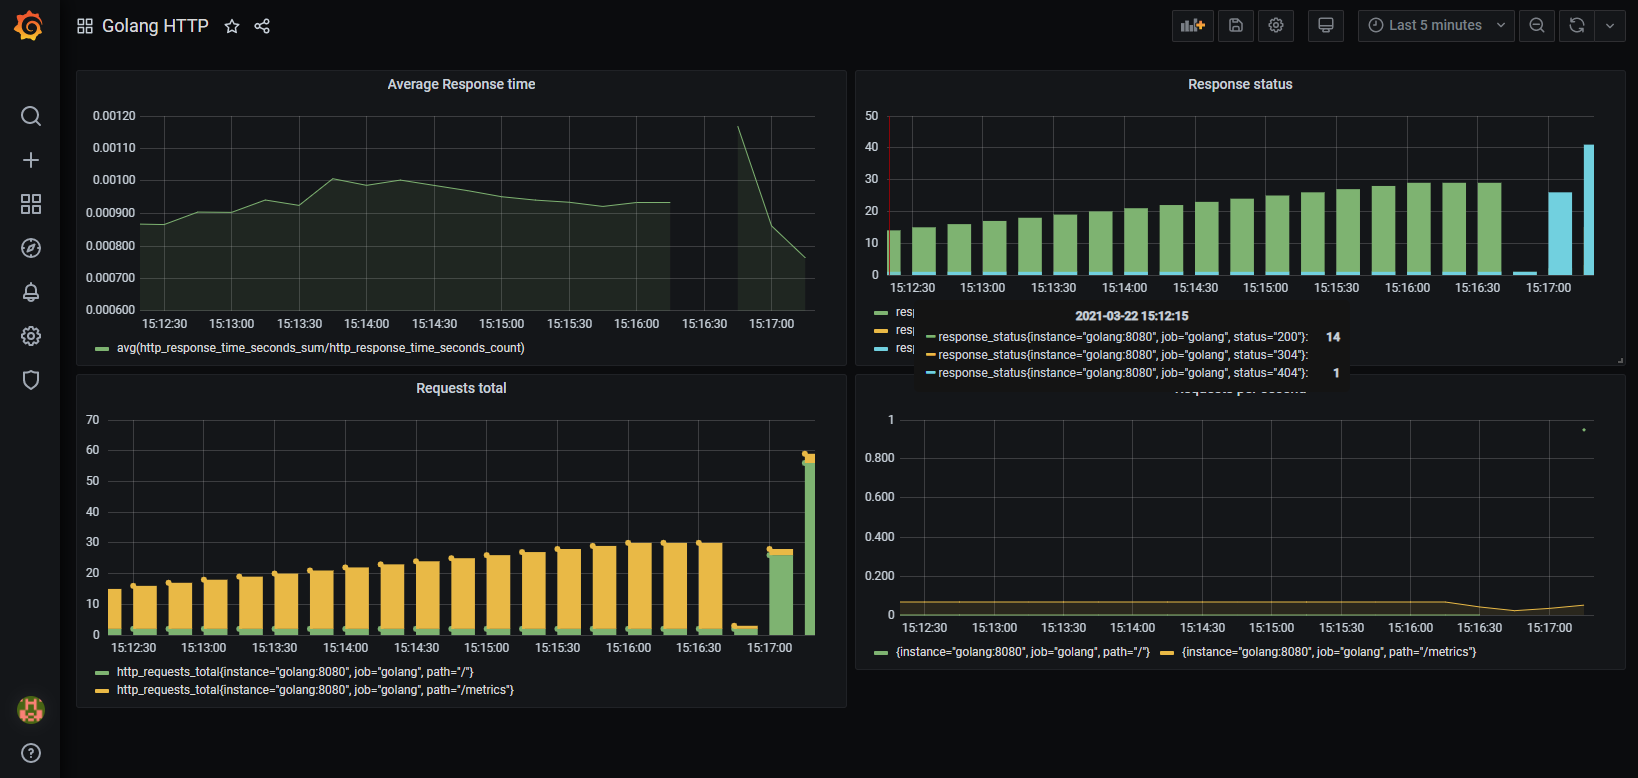
You can optionally install Graphana so that you can inspect your application metrics before using them in the canary process. The example application has an basic dashboard that you can import:
Next you need a way to filter your metrics so that you can query only those from the canary pods and not the stable pods. There are many ways to do this, but the easiest one is to simply have Argo Rollouts put special labels/tags in the canary pods. Then you can write any Prometheus Query and focus only on the canary instances:
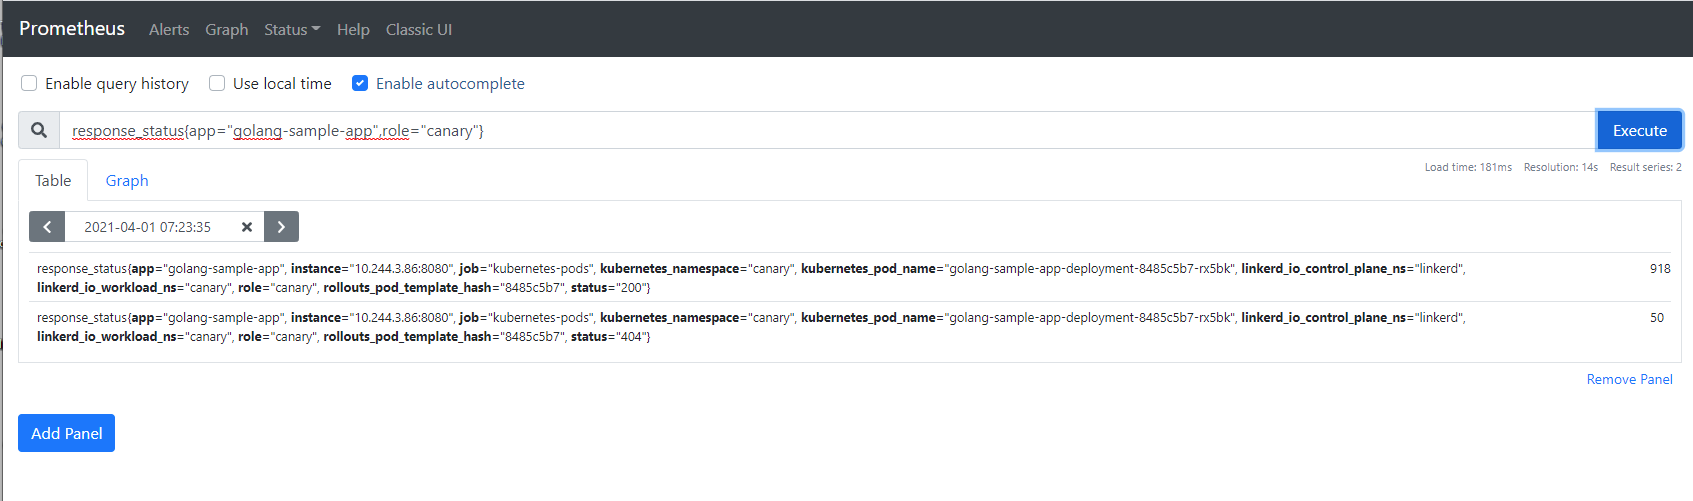
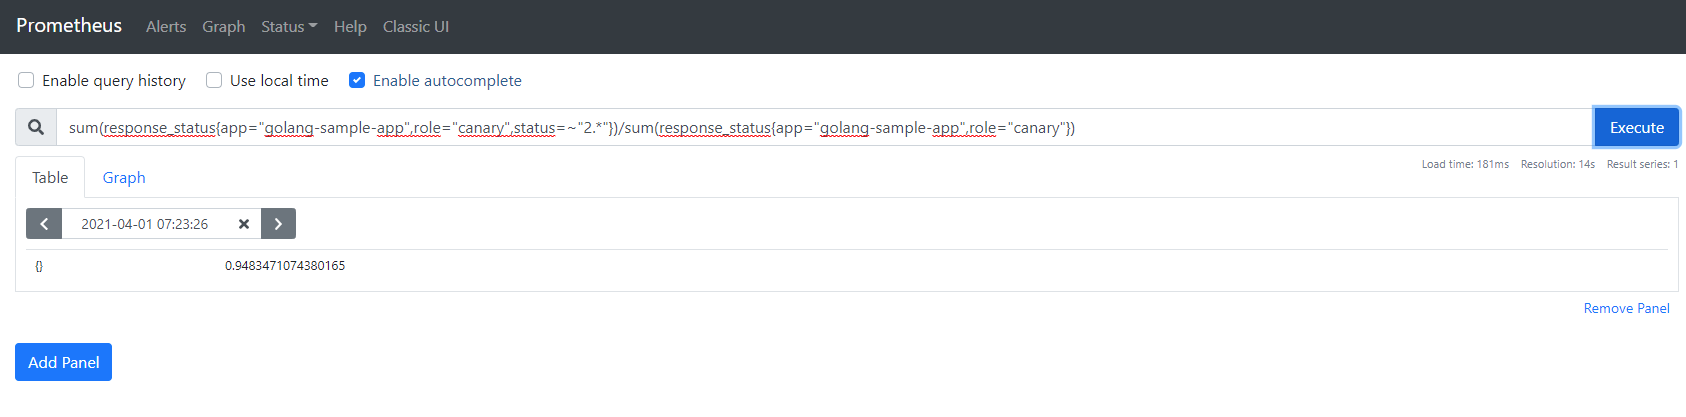
For the decision on how to promote the canary, you need to examine your application and decide which metrics you consider representative for the health of the application. For our example we have a simple query that checks number of successful calls (i.e. that return HTTP code 200) vs the number of all calls. Every number below 100% means that the application has calls that return with error.
Note that Argo Rollouts can evaluate multiple queries when deciding if the canary is health or not. You are not constrained to a single query.
Canary deployment with metric evaluation
Once your have your metric solution in place we need to instruct Argo Rollouts to use it during a deployment.
This happens with an Analysis CRD.
analysis.yaml
apiVersion: argoproj.io/v1alpha1
kind: AnalysisTemplate
metadata:
  name: success-rate
spec:
  args:
  - name: service-name
  metrics:
  - name: success-rate
    interval: 2m
    count: 2
    # NOTE: prometheus queries return results in the form of a vector.
    # So it is common to access the index 0 of the returned array to obtain the value
    successCondition: result[0] >= 0.95
    provider:
      prometheus:
        address: http://prom-release-prometheus-server.prom.svc.cluster.local:80
        query: sum(response_status{app="",role="canary",status=~"2.*"})/sum(response_status{app="",role="canary"})
This Analysis template instructs Argo Rollouts to contact the internal Prometheus server every two minutes for a query that checks the successful HTTP calls to the application. If the percentage of HTTP calls that return 200 is more than 95% then the canary will be promoted. Otherwise the canary will fail.
The Analysis can be reused by multiple deployments as the name of the service is configurable. The parameter is filled in the Rollout definition.
rollout.yaml (excerpt)
spec:
  replicas: 4
  strategy:
    canary:
      canaryService: rollout-canary-preview
      stableService: rollout-canary-active
      canaryMetadata:
        annotations:
          role: canary
        labels:
          role: canary
      trafficRouting:
        smi:
          trafficSplitName: rollout-example-traffic-split
          rootService: rollout-canary-all-traffic
      steps:
        - setWeight: 10
        - setCanaryScale:
            weight: 25
        - pause: {duration: 5m}
        - setWeight: 33
        - setCanaryScale:
            weight: 50
        - pause: {duration: 5m}
      analysis:
        templates:
        - templateName: success-rate
        startingStep: 4 # delay starting analysis run until setWeight: 10%
        args:
        - name: service-name
          value: golang-sample-app
Here you can see that instead of waiting for ever after each canary step, we instead wait for 5 minutes at 10% of traffic and 5 more minutes at 50% of traffic. During that time the Prometheus Analysis is running automatically behind the scenes.
The Codefresh pipeline is now very simple:
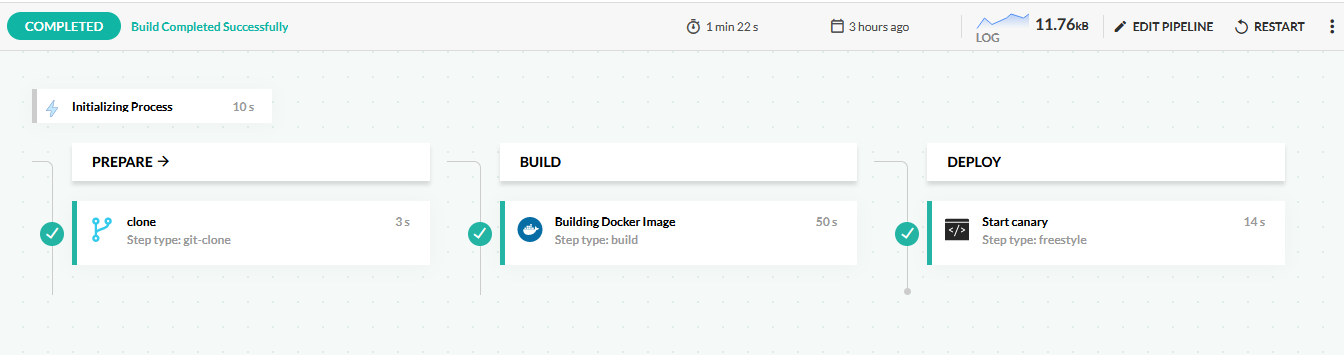
This pipeline does the following:
- Clones the source code of the application.
- Builds a Docker image.
- Deploys the application by updating the Kubernetes manifests. Argo Rollouts sees the new manifest and creates a new version and starts the canary process.
Here is the pipeline definition:
codefresh.yml
version: "1.0"
stages:
  - prepare
  - build
  - deploy
steps:
  clone:
    type: "git-clone"
    stage: prepare
    description: "Cloning main repository..."
    repo: '${{CF_REPO_OWNER}}/${{CF_REPO_NAME}}'
    revision: "${{CF_BRANCH}}"
  build_app_image:
    title: Building Docker Image
    type: build
    stage: build
    image_name: kostiscodefresh/argo-rollouts-canary-sample-app
    working_directory: "${{clone}}"
    tags:
    - "latest"
    - '${{CF_SHORT_REVISION}}'
    dockerfile: Dockerfile
    build_arguments:
      - git_hash=${{CF_SHORT_REVISION}}
  start_deployment:
    title: Start canary
    stage: deploy
    image: codefresh/cf-deploy-kubernetes:master
    working_directory: "${{clone}}"
    commands:
      - /cf-deploy-kubernetes ./canary-with-metrics/service.yaml
      - /cf-deploy-kubernetes ./canary-with-metrics/service-preview.yaml
      - /cf-deploy-kubernetes ./canary-with-metrics/service-all.yaml
      - /cf-deploy-kubernetes ./canary-with-metrics/analysis.yaml
      - /cf-deploy-kubernetes ./canary-with-metrics/rollout.yaml
    environment:
      - KUBECONTEXT=mydemoAkscluster@BizSpark Plus
      - KUBERNETES_NAMESPACE=canary
The pipeline is very simple because Argo Rollouts does all the heavy lifting behind the scenes.
You can see the Analysis running with
kubectl argo rollouts get rollout golang-sample-app-deployment --watch -n canary
For each deployment you can also see the result of the Analysis along with the canary pods. The number next to the checkmark shows how many times the analysis will run (this is defined by the count property in the Analysis file). See the Canary specification for more parameters.
Monitoring the Argo Rollouts controller
Regardless of whether you use metric evaluation for your own applications, Argo Rollouts itself exposes Prometheus metrics for its internal functionality. You can ingest those metrics like any other Prometheus application and create your own dashboards if you want to get some insights on what the controller is doing.
You can find an example dashboard at https://github.com/argoproj/argo-rollouts/blob/master/examples/dashboard.json that can be used as a starting point.
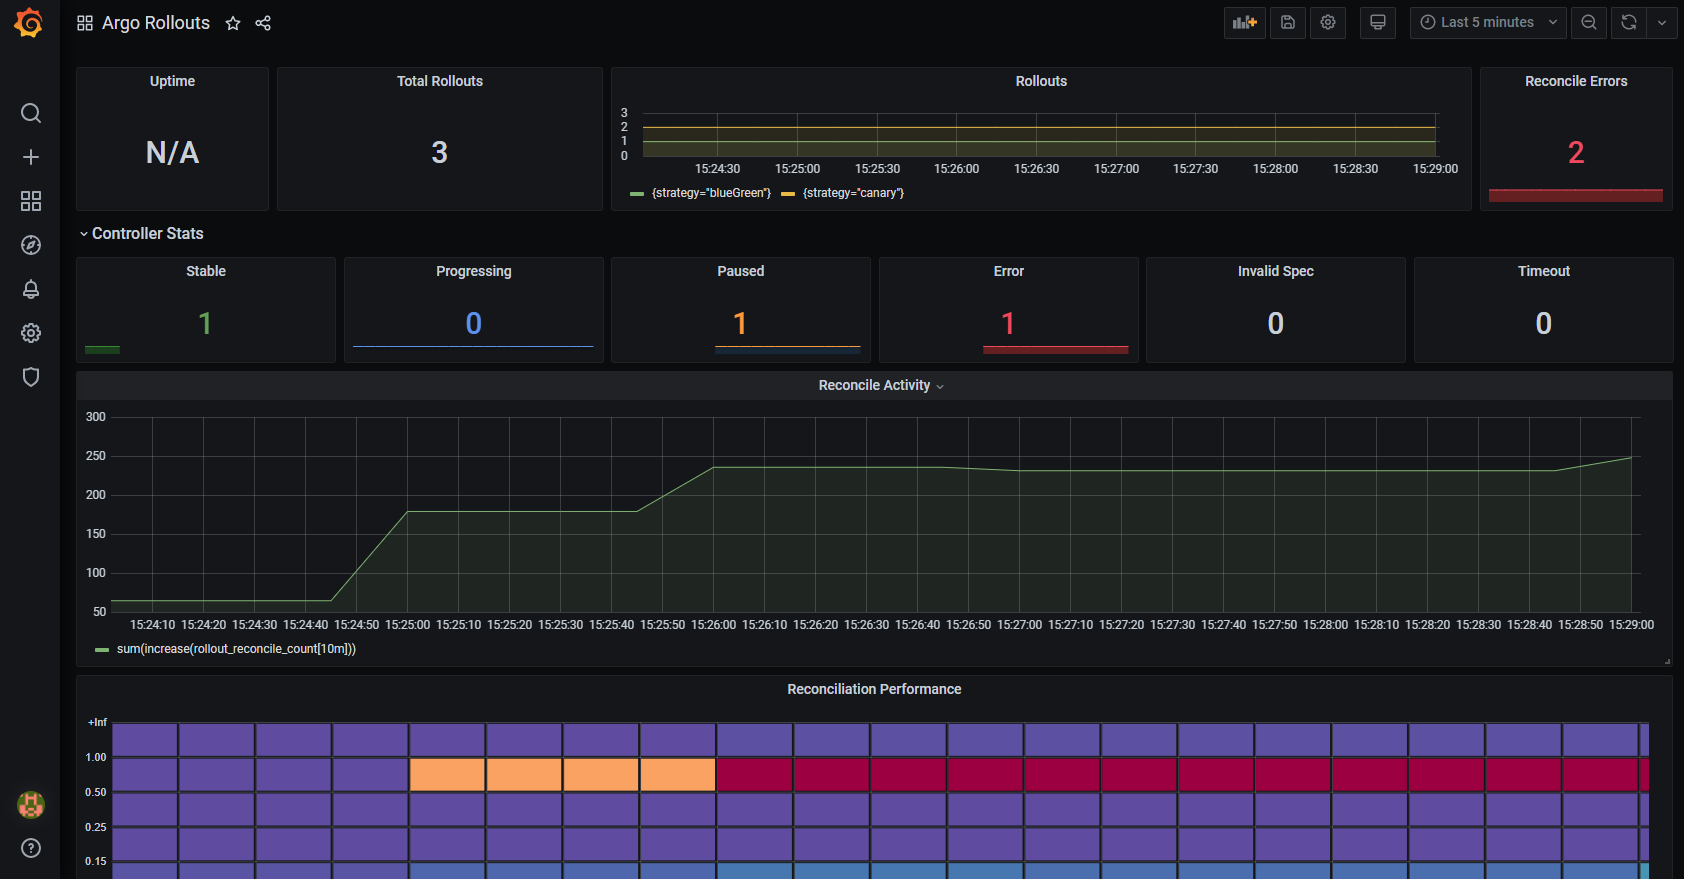
For more details, see the metrics documentation page.
Using Argo Rollouts with GitOps
For simplicity reasons, we covered progressive delivery in this page using Argo Rollouts on its own. Argo Rollouts integrates seamlessly with Argo CD bringing together GitOps and Progressive delivery.
If you use Argo CD and Argo Rollouts together you will also have access to the Codefresh GitOps dashboard to manage your deployments:
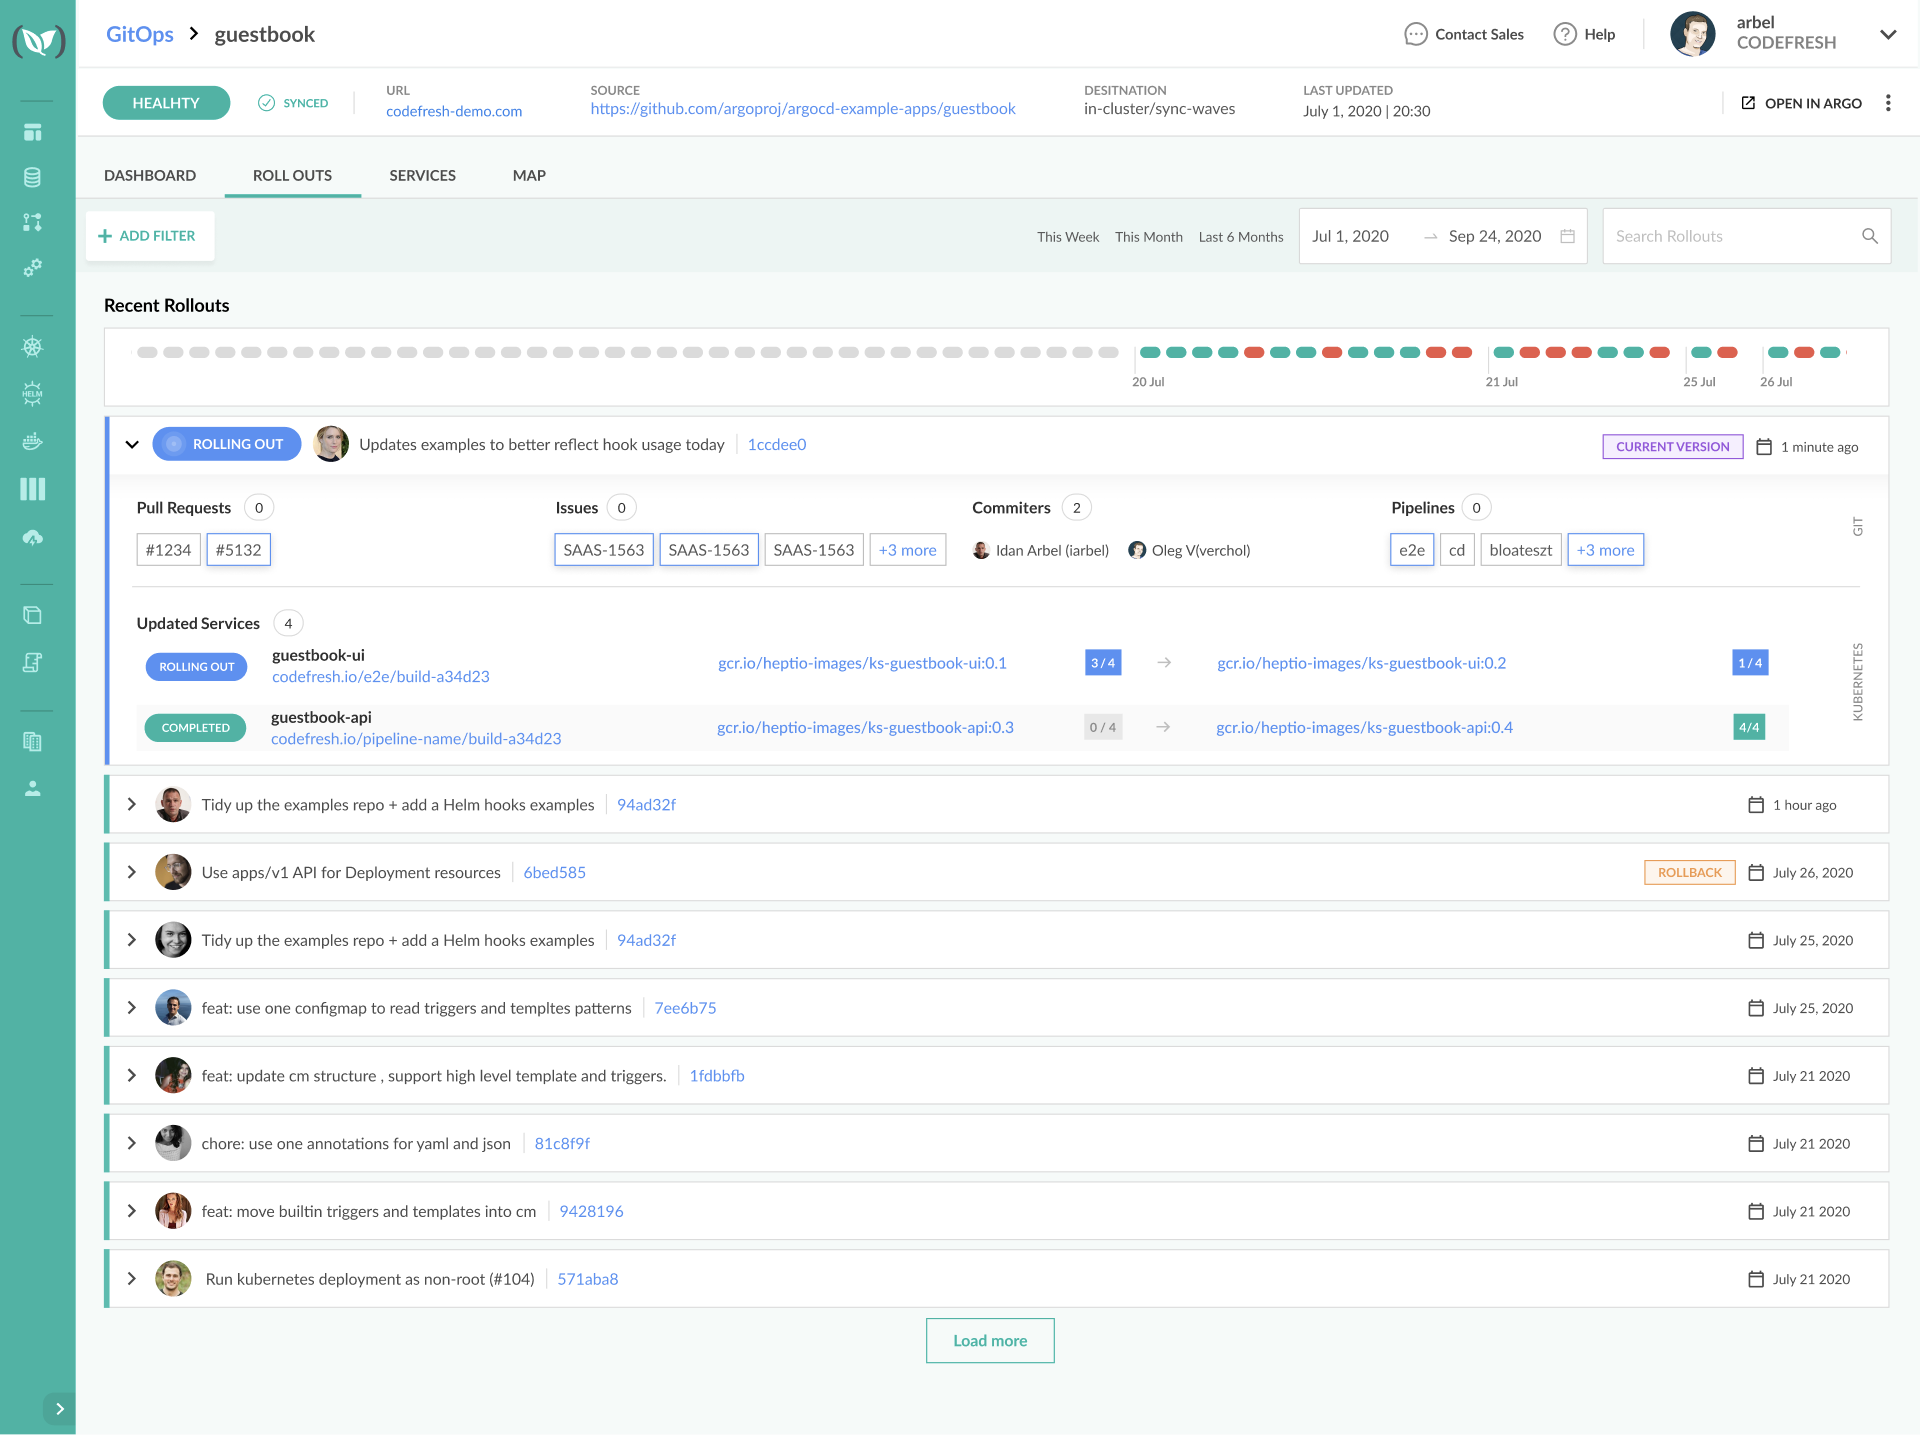
See our GitOps page for more details.