DORA metrics
Get insights into your deployments
DevOps is a collaboration paradigm that is sometimes mistaken for being too abstract or too generic. In an effort to quantify the benefits of adopting DevOps, Dora Research (acquired by Google in 2018), has introduced four key metrics that define specific goals for improving the software lifecycle in companies interested in adopting DevOps.
DORA measures these metrics:
- Deployment Frequency: How often an organization successfully releases to production
- Lead Time for Changes: The length of time for a commit to be deployed into production
- Change Failure Rate: The percentage of deployments causing a failure in production
- Time to Restore Service: The length of time for an organization to recover from a failure in production
DORA metrics in Codefresh
Monitoring DORA metrics can help identify delivery issues in your organization by detecting bottlenecks among teams and optimize your workflows at technical or organizational levels.
Codefresh offers support for DORA metrics out of the box.
- In the Codefresh UI, from Artifacts & Insights in the sidebar, select DORA metrics.
Filters
Use filters to define the exact subset of Argo CD applications you are interested in. All filters support auto-complete and multiselect. More than one option within the same filter type has an OR relationship. Multiple filter types when defined share an AND relationship.
NOTES
When no filters are defined, all metrics are shown for the last 90 days.
To view filters that are not displayed, click More filters.
- Runtimes: Show metrics for applications from selected runtimes
- Clusters: Show metrics for applications deployed to selected clusters
- Applications: Show metrics for selected applications.
- Time: Show metrics from application for a specific time period
- Products: Show metrics from applications within the specified Product(s).
- Environments: Show metrics from applications within the specified Environments.
- App Groups: Show metrics from applications within the specified Application Groups.
Metrics for favorite applications
If you have starred applications as favorites in the Applications dashboard, clicking ![]() in DORA metrics, displays DORA metrics only for those applications.
in DORA metrics, displays DORA metrics only for those applications.
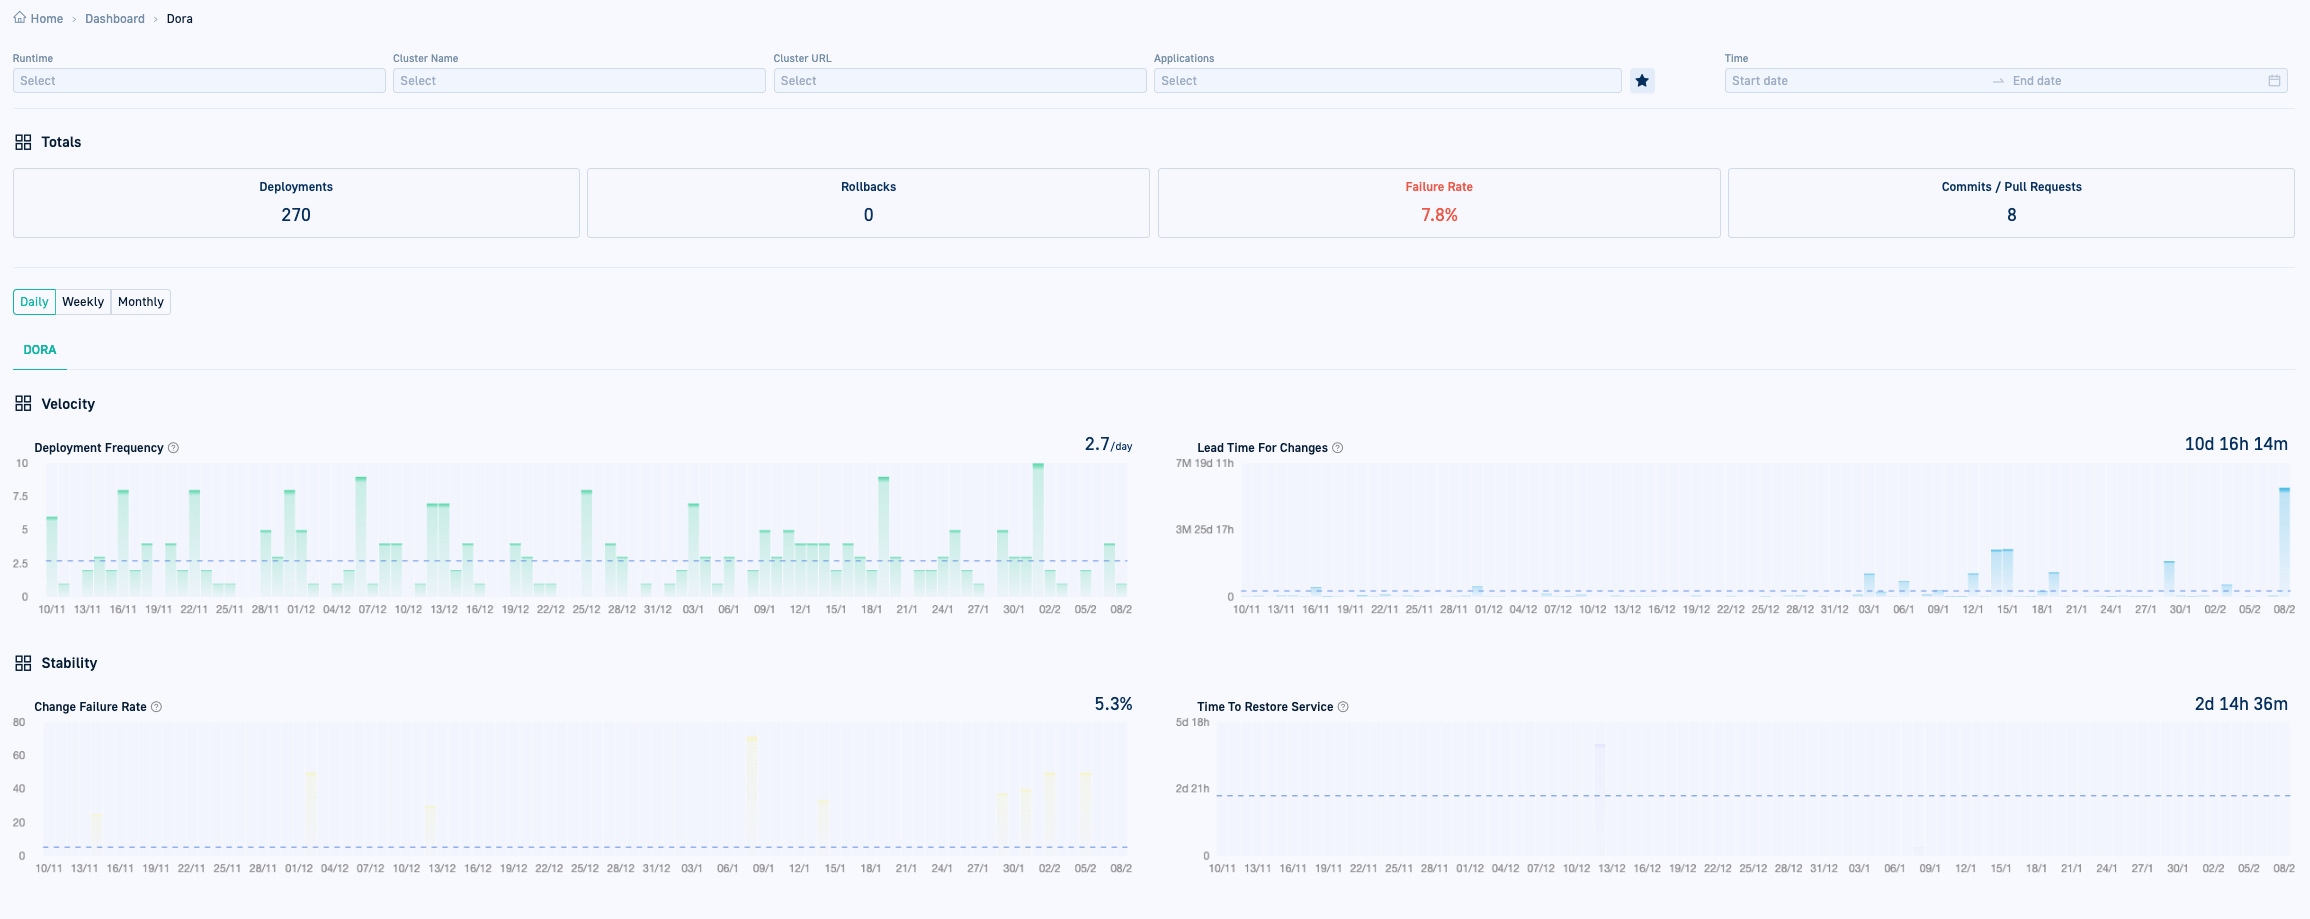
Metric totals
As the title indicates, the Totals bar shows the total numbers, based on the filters defined, or for the last 90 days, if there are no filters:
- Deployments
- Rollbacks
- Commits/Pull Requests
- Failure Rate: The number of failed deployments divided by the total number of deployments
Metric graphs
The metric graphs are key to performance insights with DORA metrics. The metrics are again based on the filters defined, or for the last 90 days if there are no filters.
In addition, you can select the granularity for each graph:
- Daily
- Weekly
- Monthly
TIP
Remember that the graphs for the DORA metrics reflect metrics of application deployments, not workflows.
Deployment Frequency
The frequency at which applications are deployed to production, including both successful (Healthy) and failed (Degraded), deployments. A deployment is considered an Argo CD sync where there was a change in the application source code that resulted in a new deployment of the application to production.
The X-axis charts the time based on the granularity selected, and the Y-axis charts the number of deployments. The number shown on the top right is the average deployment frequency based on granularity.
Lead Time for Changes
The average number of days from the first commit for a PR (pull request) until the deployment date for the same PR. The key term here is deployment. Lead Time for Changes considers only those changes to workflows that result in a deployment. Making a change to a repo that does not result in a deployment is not included when calculating Lead Time for Changes.
The X-axis charts the time based on the granularity selected, and the Y-axis charts the time in minutes until the deployment. The number shown on the top right is the average number of days for a commit to reach production.
Change Failure Rate
The failure or rollback rate in percentage for applications whose health status changed to Degraded on deployment. The key term here is on deployment. For example, bumping an image tag with one that does not exist, results in the application being Degraded on deployment, and designated as failed.
The Change Failure Rate is derived by dividing the number of Degraded (failed/rollback) deployments with the total number of deployments. The X-axis charts the time based on the granularity selected, and the Y-axis charts the failure rate. The number shown on the top right is the average failure rate based on granularity, and therefore may not be equal to the Total Failure Rate.
Time to Restore Service
The average number of hours taken for the status of Degraded deployments to return to Healthy. Again, similar to the Change Failure Rate, Time to Restore Service includes only deployments that became Degraded. It is derived by dividing the total number of hours for all Degraded deployments to return to Healthy by the total number of Degraded deployments.
The X-axis charts the time based on the granularity, and the Y-axis charts the time in hours. The number shown on the top right is the average number of hours between the previous deployment and rollback for the same application.
Related articles
Home dashboard
Monitoring applications
GitOps Environments dashboard
GitOps Products dashboard