How to: Upgrade Deprecated Docker Images in Classic Pipelines
Find and upgrade deprecated Docker v1 and schema 1 images to support docker-27 runner in Classic Pipelines.
How to: Upgrade to the newer classic docker-27 runner
As part of our ongoing platform upgrades, we’re moving to a newer classic runner version based on docker ver 27. This change deprecates older Docker image formats, and you may need to identify and upgrade deprecated images in your pipelines.
This guide will help you:
-
Identify deprecated Docker images in your Classic Pipelines. (Step 1)
-
Upgrade those images to a modern, supported format. (Step 2)
Step 1: Find Deprecated Docker Images
There are two recommended approaches to identify deprecated images in your Classic Pipelines.
Analyze Build Logs
This method scans historical build logs for deprecation warnings.
How it works:
Latest versions of dind print deprecation warning into build logs each time Docker daemon tries to pull a deprecated image.
Example:
[DEPRECATION NOTICE] Docker Image Format v1 and Docker Image manifest
version 2, schema 1 support is disabled by default...
Use the following script to scan logs and extract deprecated image names: Find deprecated images used in previous builds
💡 For large-scale environments with thousands of builds, we offer a more scalable, metrics-based detection method. See Appendix I for details.
Step 2: Upgrade Deprecated Docker Images
Once you’ve identified deprecated images using engine metrics, the next step is to upgrade those images to a modern format (OCI or Docker manifest v2, schema 2). This is required to ensure compatibility with docker-27 and future releases.
How It Works
Re-pushing an image using a modern Docker client will automatically convert its manifest to a supported version.
Sample Codefresh Pipeline to Upgrade an Image
You can automate this process with a Codefresh pipeline like the one below:
1. version: "1.0"
2.
3. steps:
4.   push:
5.     title: "Re-pushing deprecated image"
6.     type: push
7.     candidate: <source-image-name>
8.     registry: <target-registry>
9.     tag: <target-tag>
10.     image_name: <target-image-name>
11.
12. # Example:
13. # push:
14. #   title: "Re-pushing deprecated image"
15. #   type: push
16. #   candidate: docker/whalesay:latest
17. #   registry: docker
18. #   tag: new-manifest
19. #   image_name: codefresh/whalesay
This pulls the deprecated image and re-pushes it under a new name/tag with a compliant manifest format.
💡 You can repeat this process for each deprecated image discovered via metrics or logs.
Appendix I:
Monitor Engine Metrics
This method enables scalable detection of deprecated images by using real-time engine metrics. Recommended for high-volume or automated environments.
Monitor engine metrics
Starting from Runtime v7.5.0, engine emits codefresh_engine_deprecated_images_pulled_total{ account_name, pipeline_id, workflow, image_name } metric, which should be monitored to detect deprecated images pulled within DIND.
This metric is a counter increased by 1 each time Docker daemon pulls a deprecated image.
How to enable
Set the following values for the Hybrid Runtime Chart:
1. runtime:
2.   engine:
3.     env:
4.       METRICS_PROMETHEUS_ENABLED: true
5. podMonitor:
6.   main:
7.     enabled: true
Before normal shutdown, the engine pod waits for the scrape of the metrics. This helps ensure that the latest metric values are not missed.
The timeout is controlled by the METRICS_PROMETHEUS_SCRAPE_TIMEOUT engine variable. If you want to be sure that the Prometheus operator will scrape the latest metric values before the engine exits, we recommend setting this variable to 4 times your scrape interval.
To do so, adjust your Hybrid Runtime Chart values:
1. runtime:
2.   engine:
3.     env:

4.       # Timeout in ms
5.       METRICS_PROMETHEUS_SCRAPE_TIMEOUT: '120000'
How to monitor
Installation of the monitoring stack is up to the customer and not covered by our support.
This section provides very basic instructions suitable for the purpose of this doc, however, they may not meet customer’s long-term production needs and may require some adjustment by the end user.
If the monitoring stack is not installed in the target cluster, the easiest way is to install kube-prometheus-stack Chart: kube-prometheus-stack 75.6.2 · prometheus/prometheus-community
While installing, please consider enabling persistence for the Prometheus operator so that collected metrics are not purged on node rotation. Please follow the official docs for details (check prometheus.prometheusSpec.storageSpec value).
Example installation
kube-prom-storage-class.yaml
1. # kube-prom-storage-class.yaml
2.
3. apiVersion: storage.k8s.io/v1
4. kind: StorageClass
5. metadata:
6.   name: kube-prom
7. provisioner: kubernetes.io/aws-ebs
8. parameters:
9.   type: gp3
kube-prom-values.yaml
1. # kube-prom-values.yaml
2.
3. prometheus:
4.   prometheusSpec:
5.     podMonitorSelectorNilUsesHelmValues: false
6.     serviceMonitorSelectorNilUsesHelmValues: false
7.     storageSpec:
8.       volumeClaimTemplate:
9.         spec:
10.           storageClassName: kube-prom
11.           accessModes: ["ReadWriteOnce"]
12.           resources:
13.             requests:
14.               storage: 20Gi
15. grafana:
16.   persistence:
17.     storageClassName: kube-prom
18.     enabled: true
19.   datasources:
20.     datasources.yaml:
21.       apiVersion: 1
22.       datasources:
23.         - name: Mimir API
24.           type: marcusolsson-json-datasource
25.           uid: Mimir-API
26.           access: proxy
27.           url: http://kube-prom-kube-prometheus-prometheus:9090/api/v1
28.   plugins:
29.     - marcusolsson-json-datasource
Helm installation
1. helm repo add prometheus-community https://prometheus-community.github.io/helm-charts
2. helm repo update
3. helm install kube-prom prometheus-community/kube-prometheus-stack --create-namespace --namespace kube-prom -f ./kube-prom-values.yaml
Please follow instructions provided by Helm after successful installation to get access to the newly installed Grafana instance:
1. kubectl --namespace kube-prom get pods -l "release=kube-prom"
2. kubectl --namespace kube-prom get secrets kube-prom-grafana -o jsonpath="{.data.admin-password}" | base64 -d ; echo
3. export POD_NAME=$(kubectl --namespace kube-prom get pod -l "app.kubernetes.io/name=grafana,app.kubernetes.io/instance=kube-prom" -oname)
4. kubectl --namespace kube-prom port-forward $POD_NAME 3000
You can now log in to Grafana at http://localhost:3000 as an admin user. Double-check the instructions above for the password.
Verifying metrics
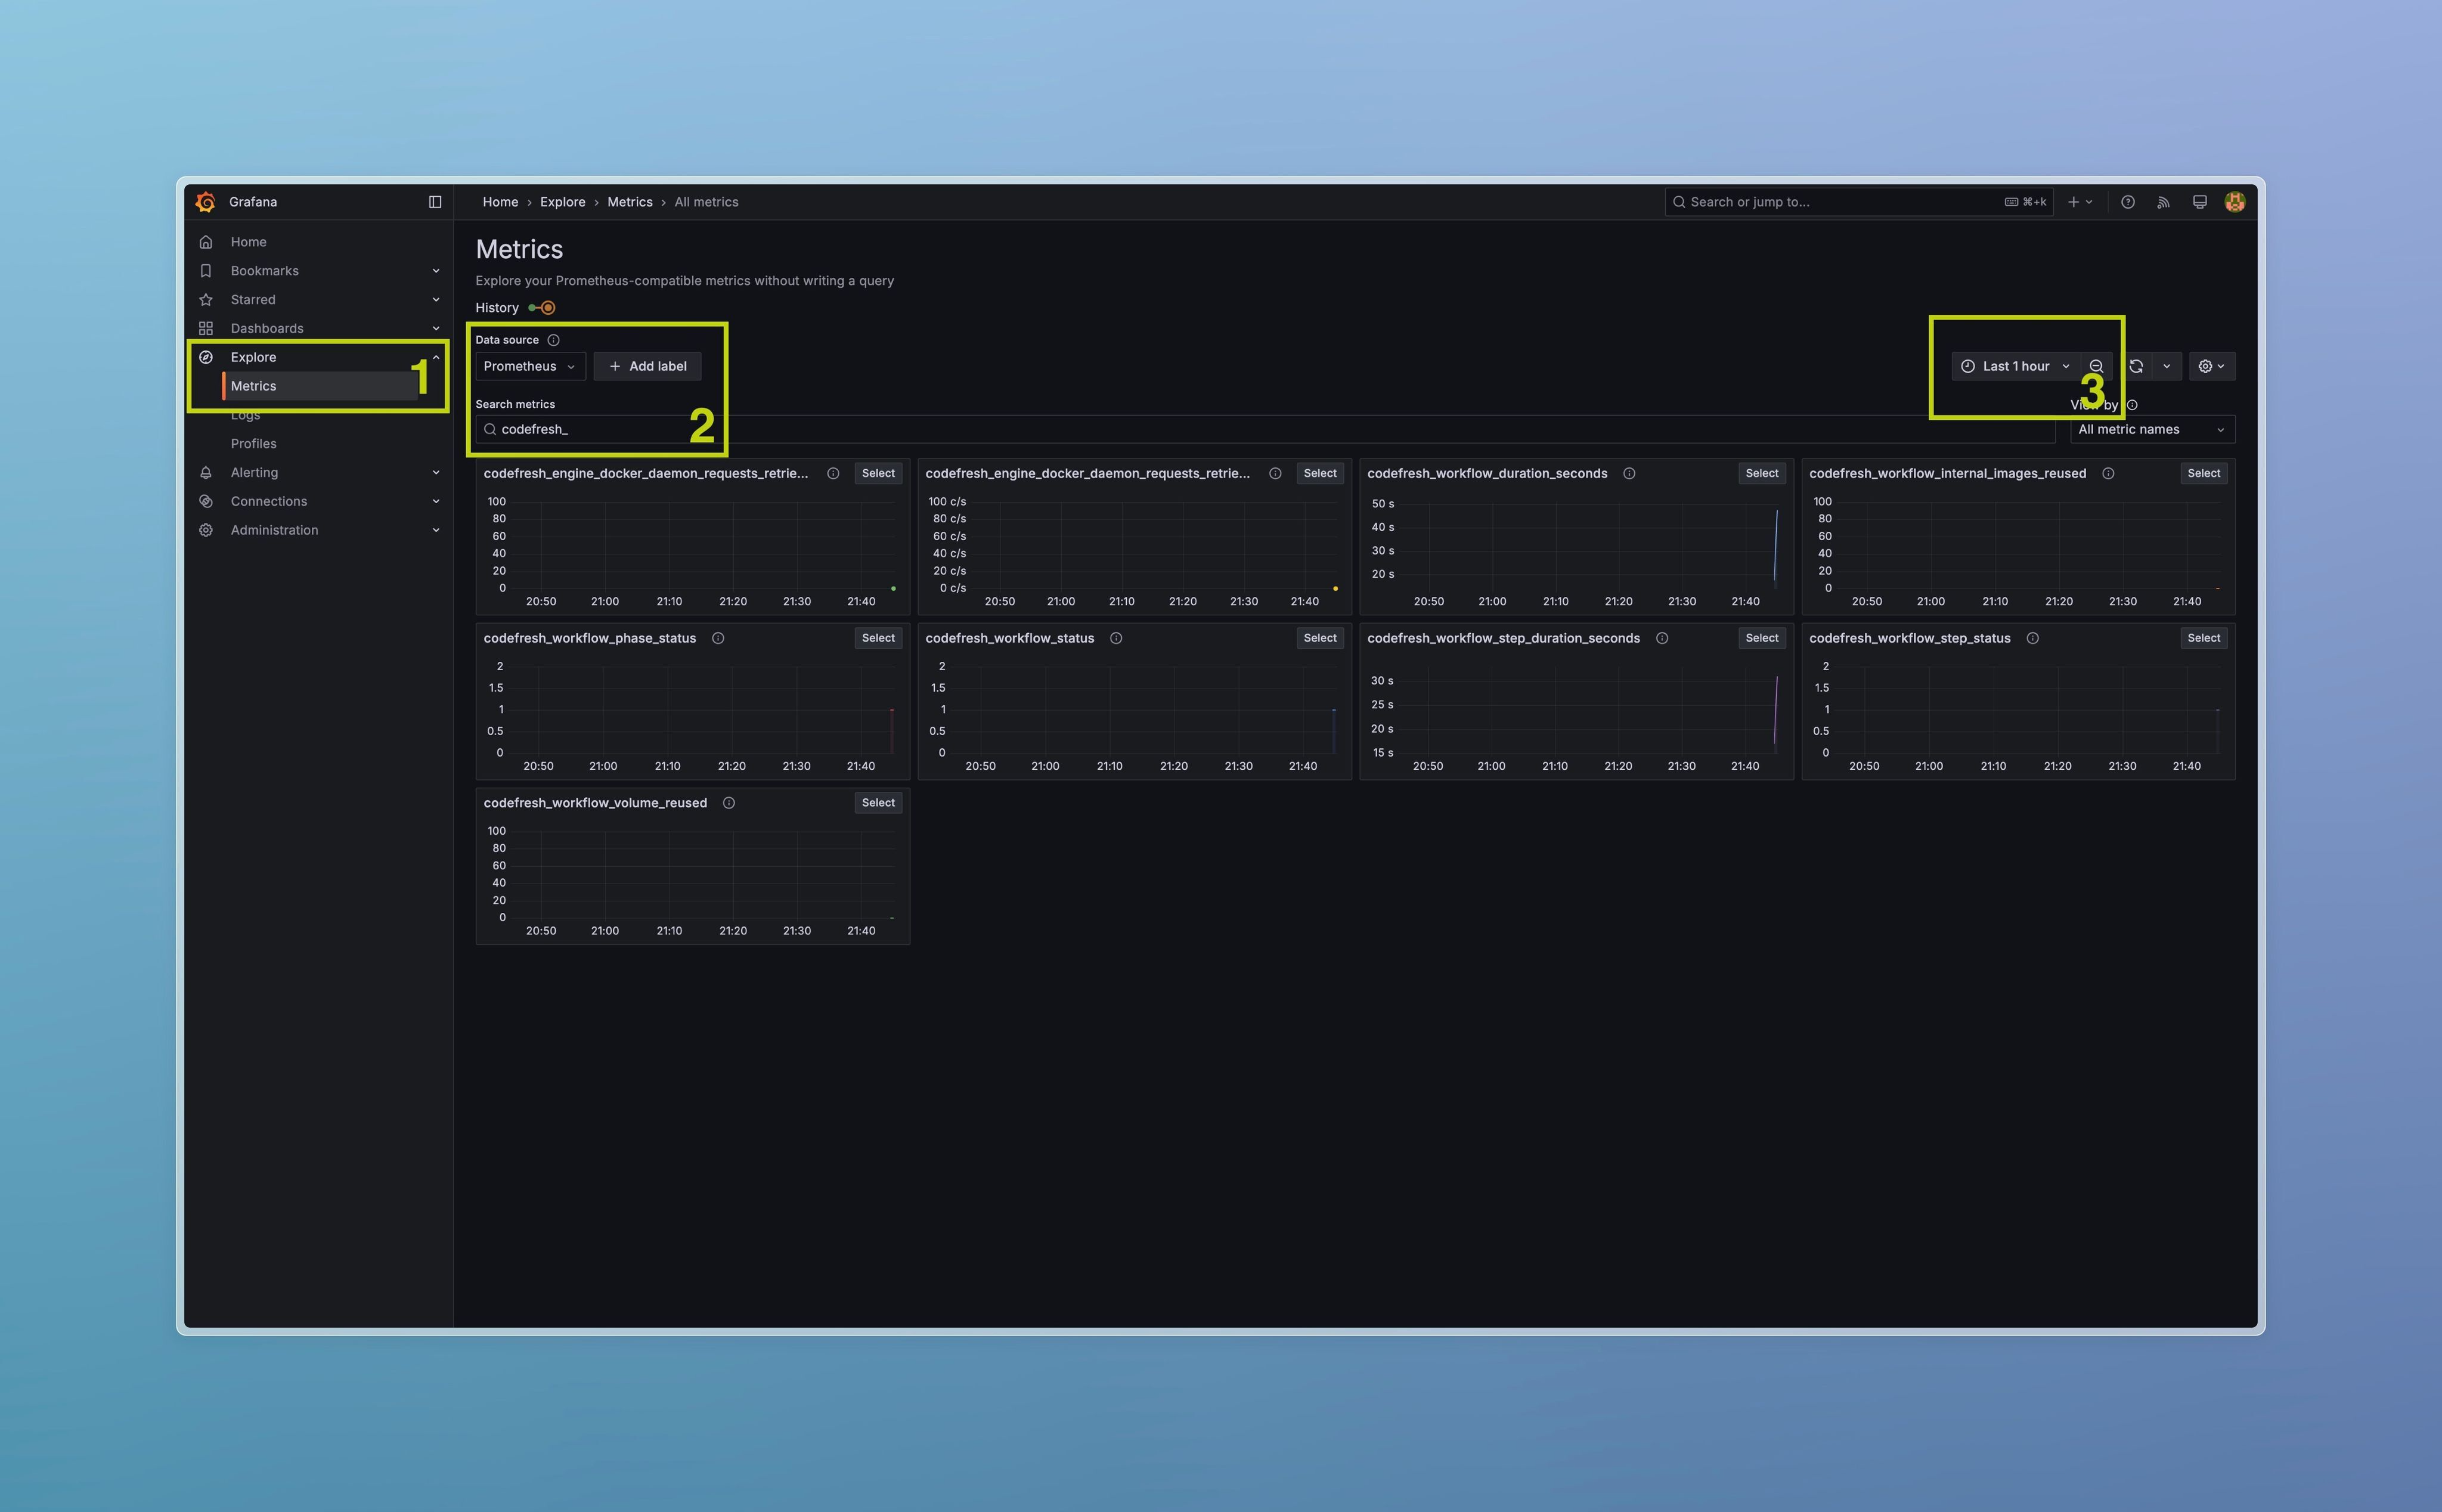
To ensure that engine metrics are collected correctly, run some build on the Runtime under monitoring. Login to Grafana, open “Explore → Metrics” in the left-hand menu. Type codefresh_ in “Search” field, ensure that time range covers at least one running build. You will see a list of available metrics.
How to use/understand metrics
codefresh_engine_deprecated_images_pulled_total metric is a counter increased by 1 each time Docker daemon pulls a deprecated image. Labels {account_name, pipeline_id, workflow, image_name} allow you to group results.
Grafana dashboard
Easiest way to analyze data — to use the attached Grafana dashboard.
1. Download this Grafana dashboard json
2. Login to Grafana
3. Open “Dashboards → New → Import”
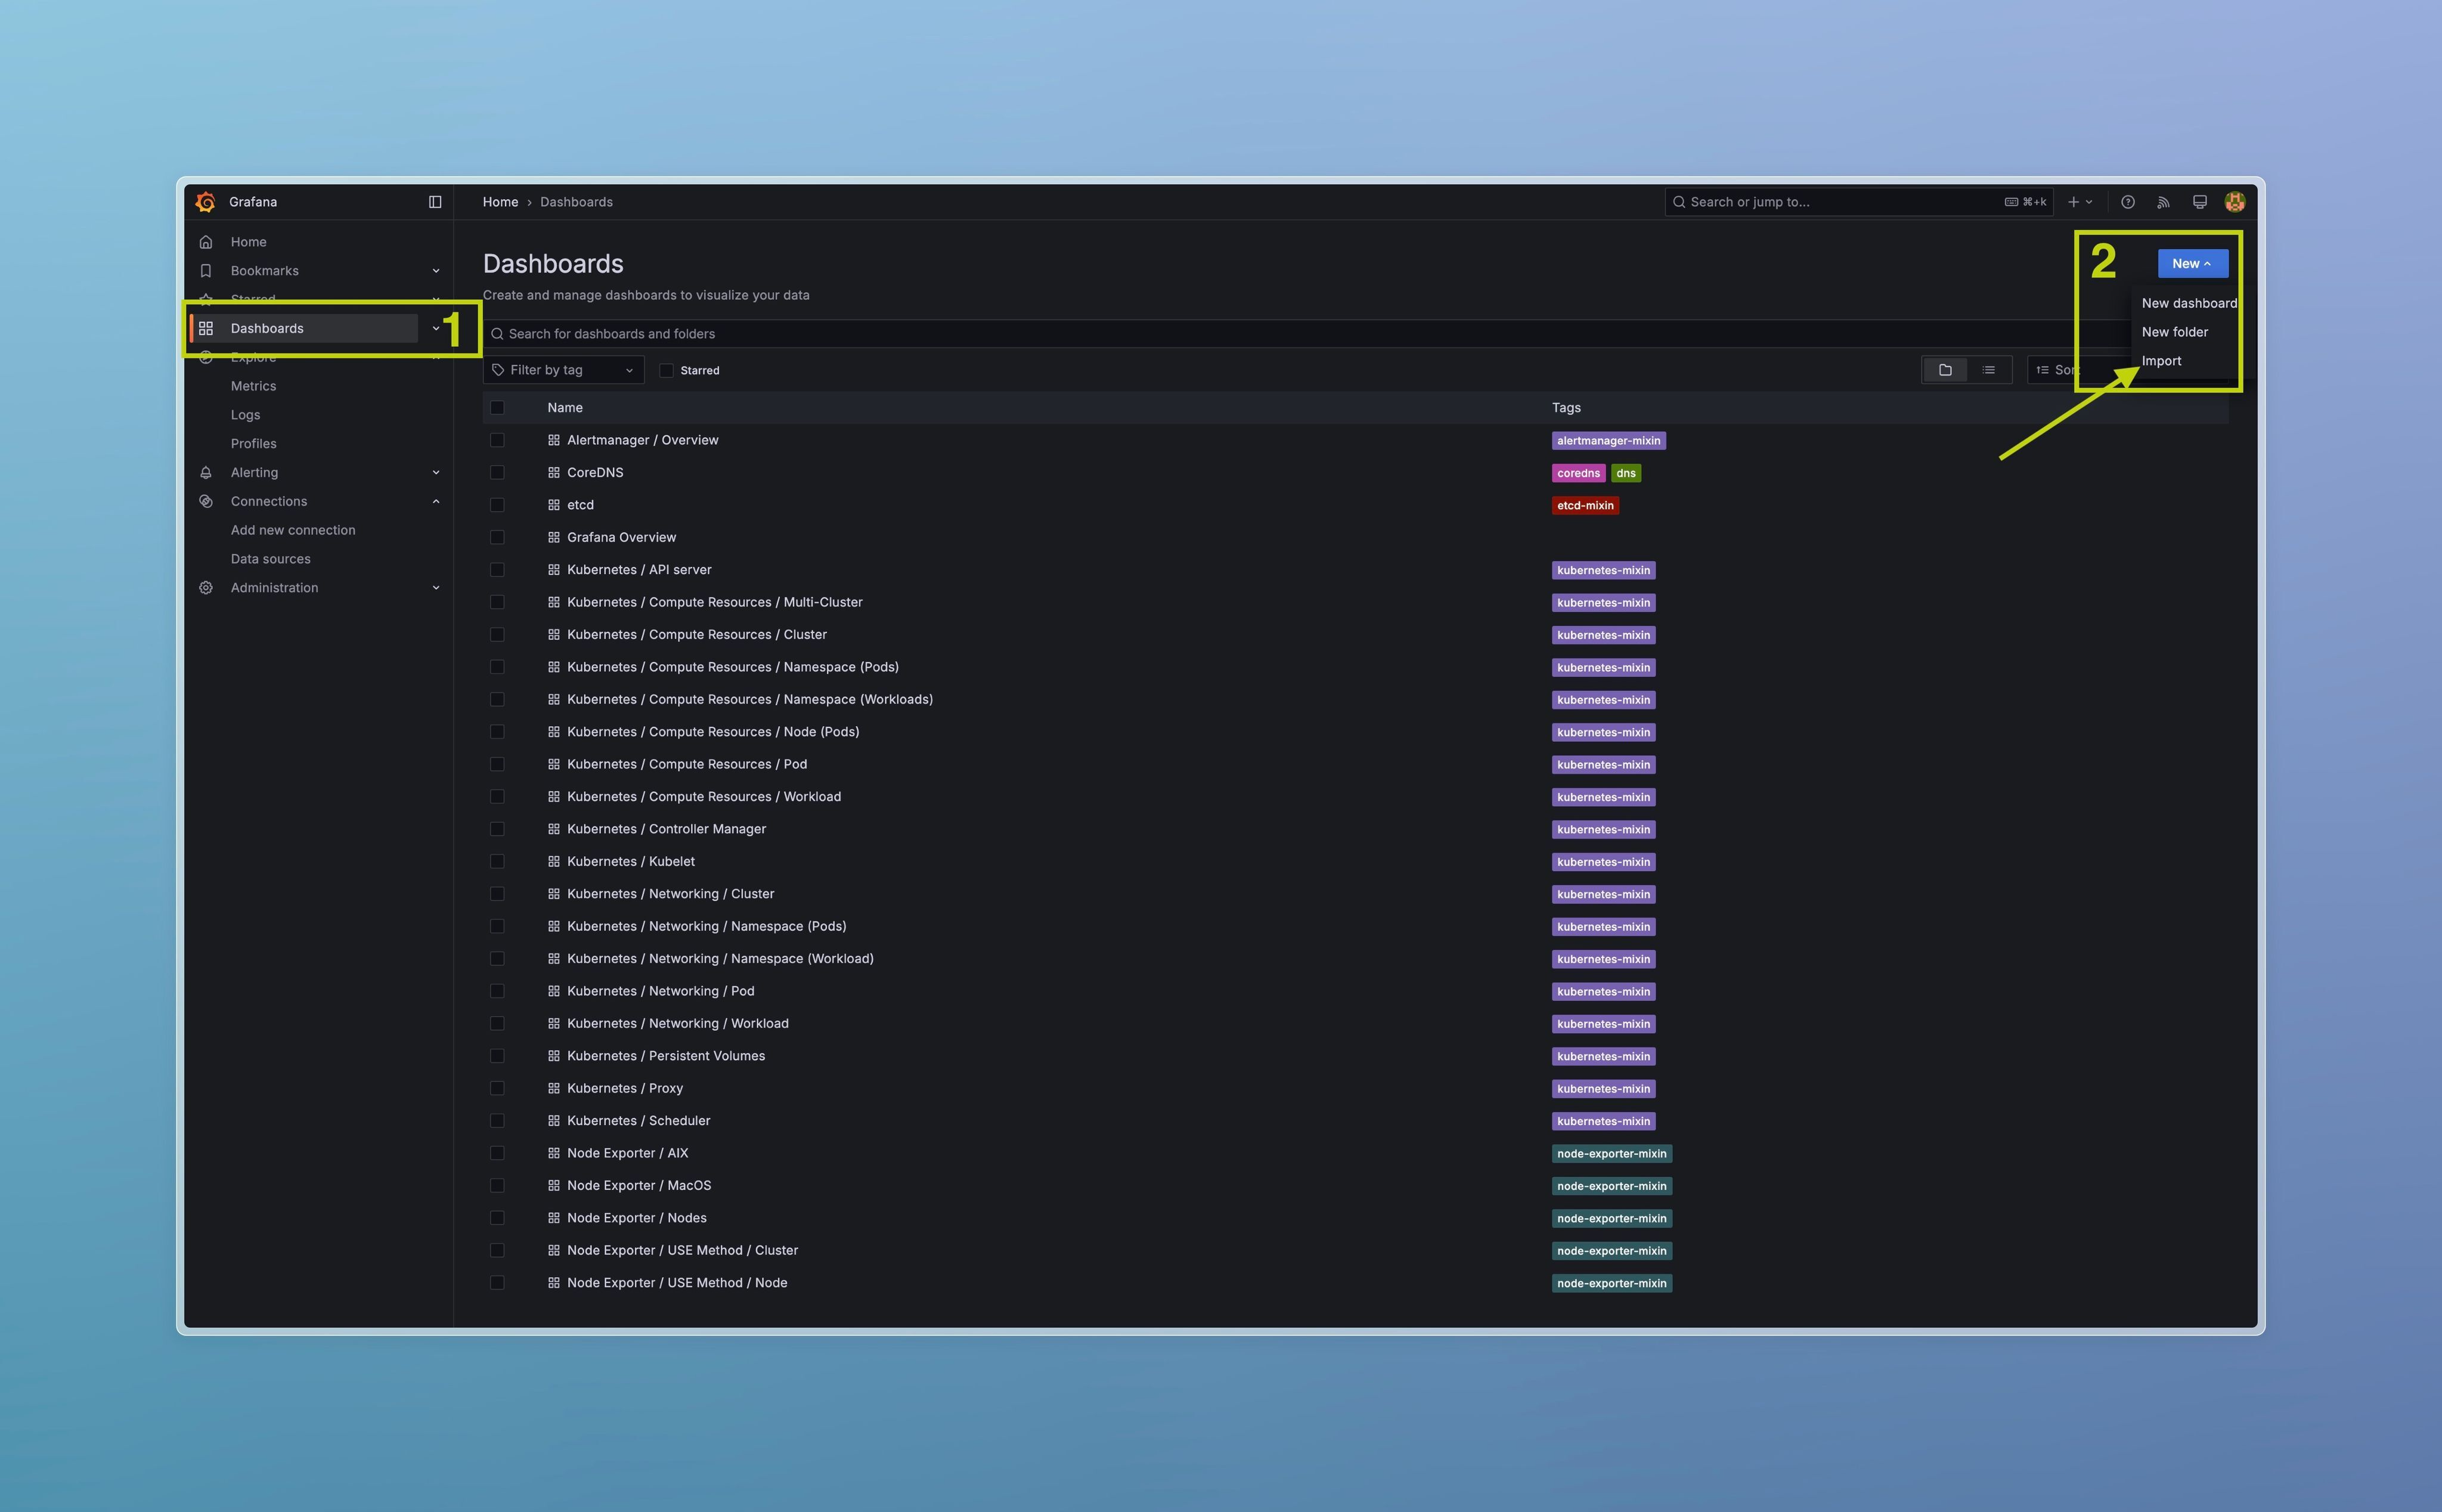
4. Upload Dashboard JSON
5. Select “Select a JSON API data source → Mimir API”. Click “Import”

6. Done! 🎉
Deprecated Images Dashboard overview
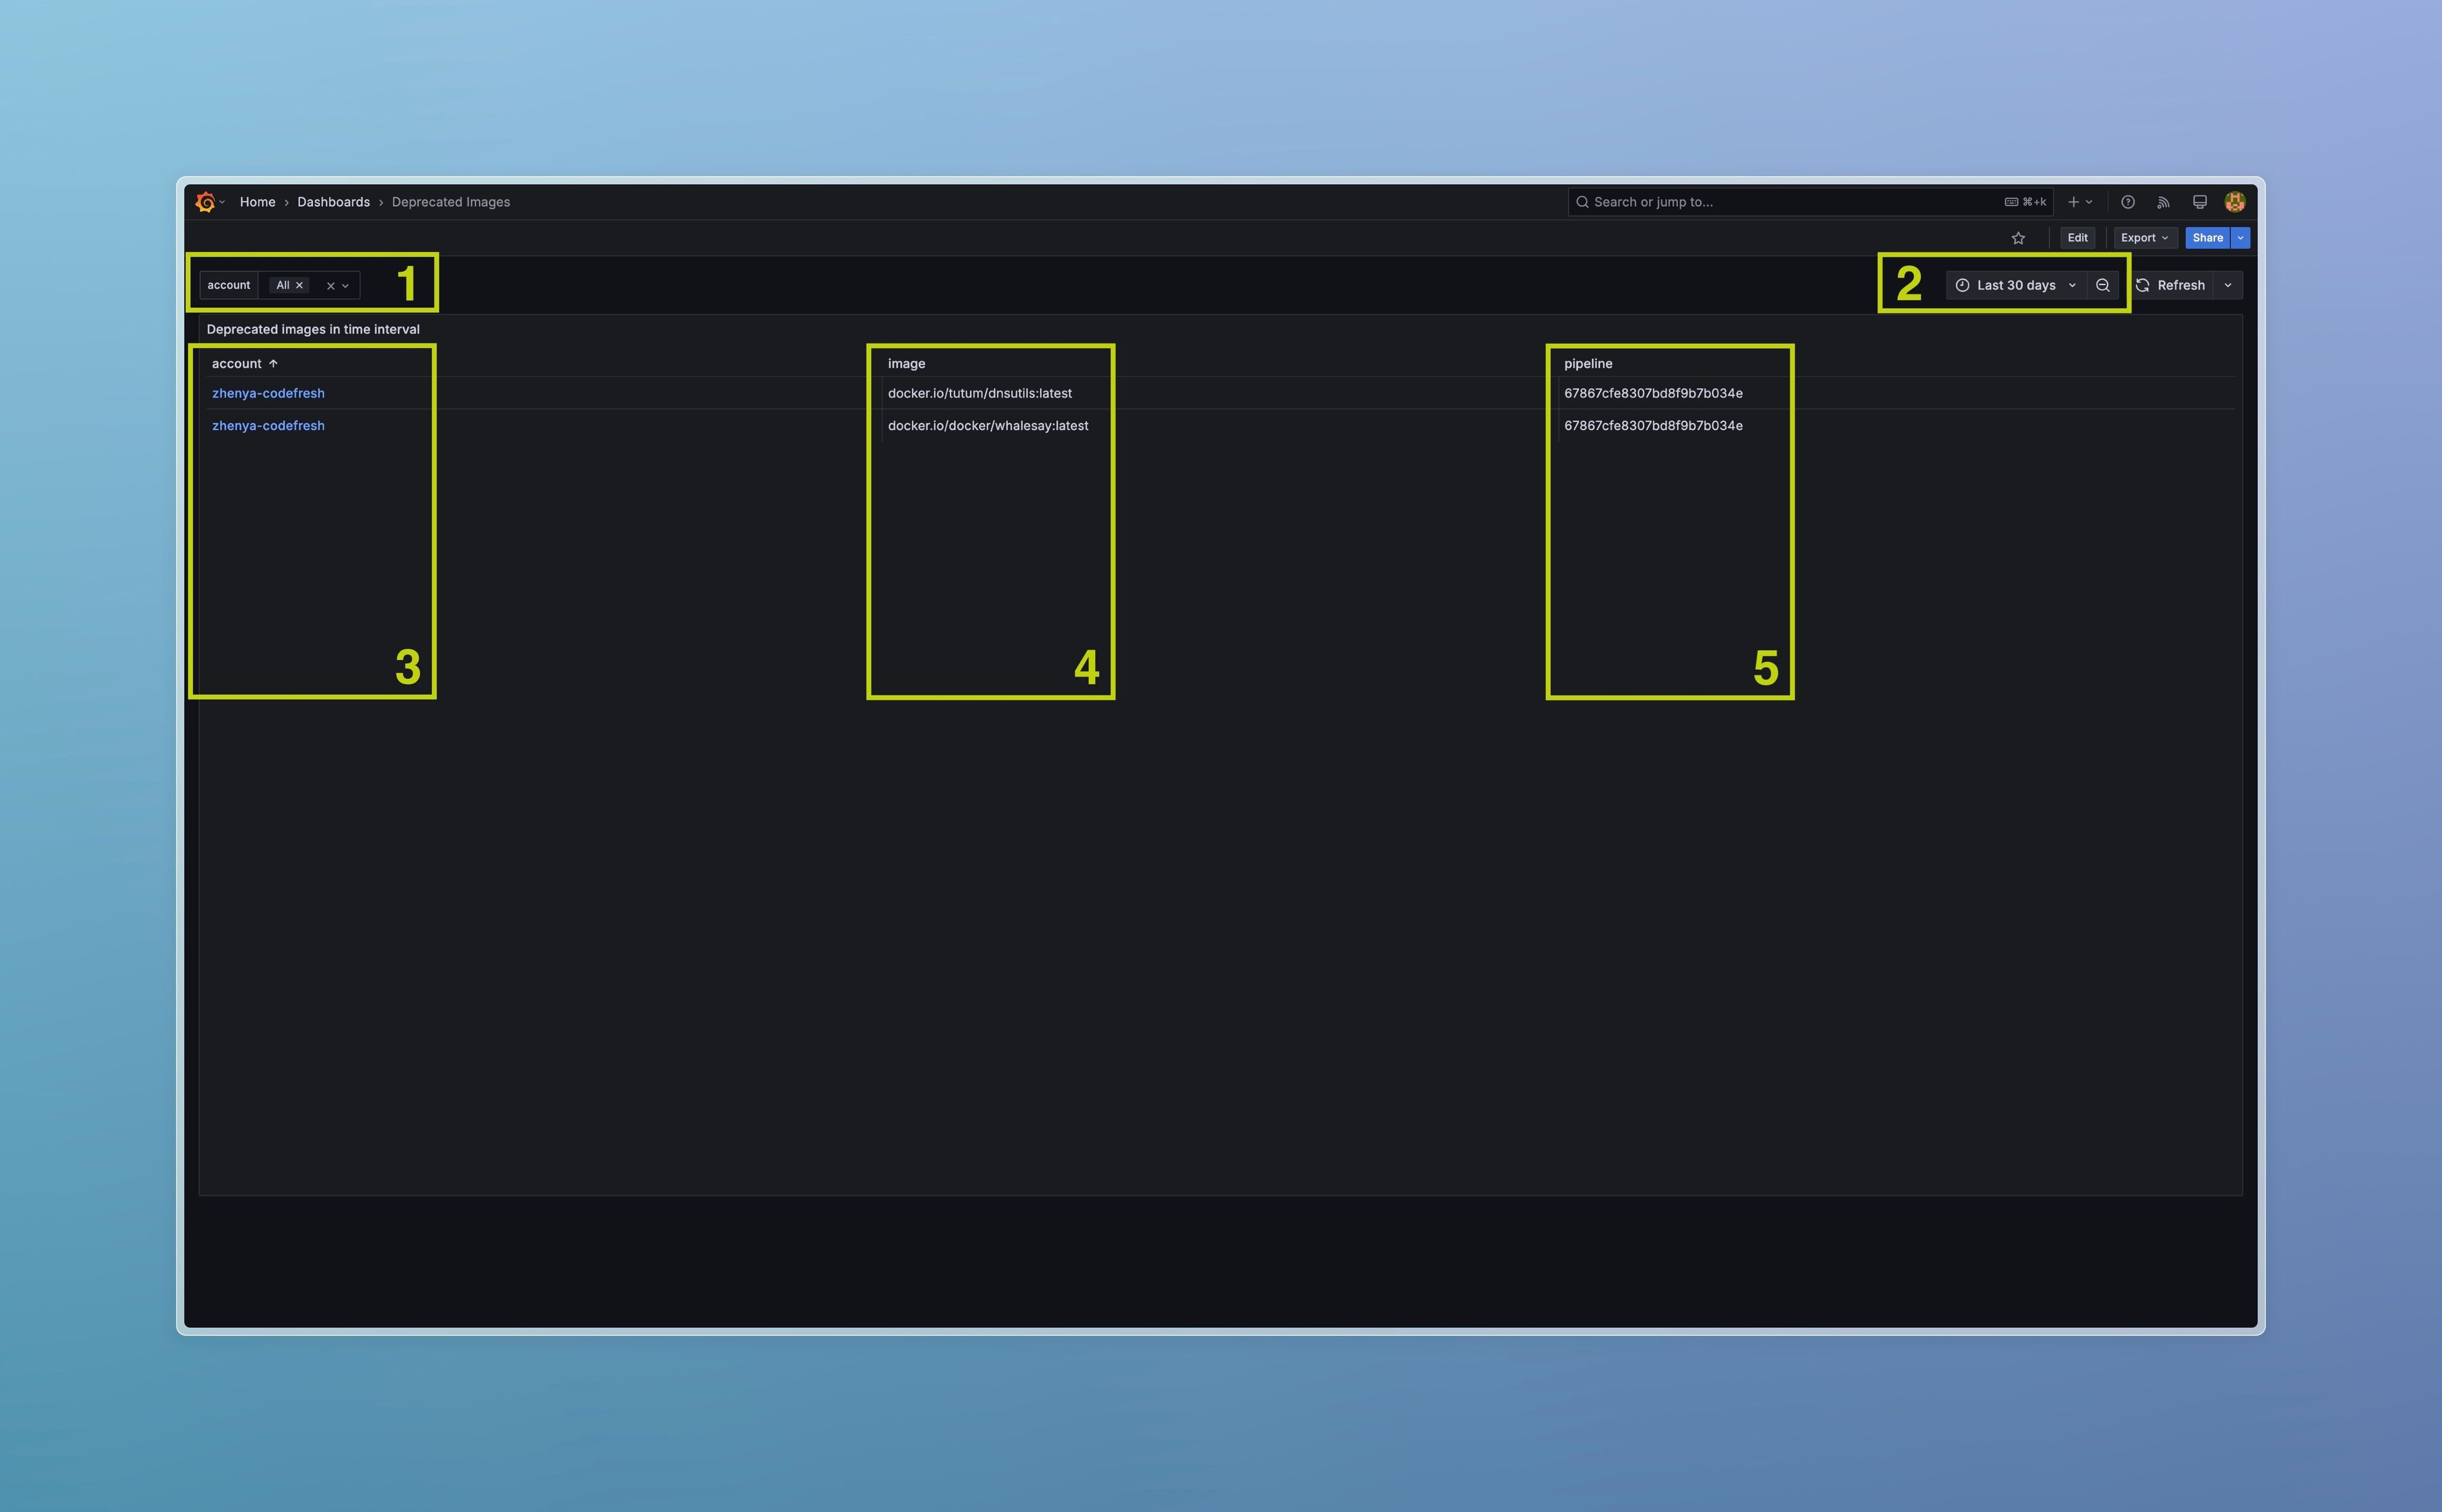
On the screenshot above:
- Filter by account name.
- Time range.
- Account name (build owner). Link leads to the Admin Panel.
- Deprecated image name.
- Pipeline ID where pull was detected.
Query Prometheus metric
You can query codefresh_engine_deprecated_images_pulled_total metric directly. Consider the following query, that returns per second rate of deprecated images pulls, aggregated by account ID, pipeline ID, build and image:
1. sum(
2.  rate(
3.    codefresh_engine_deprecated_images_pulled_total
4.  [$__rate_interval])
5. ) by (account_name, pipeline_id, workflow, image_name)
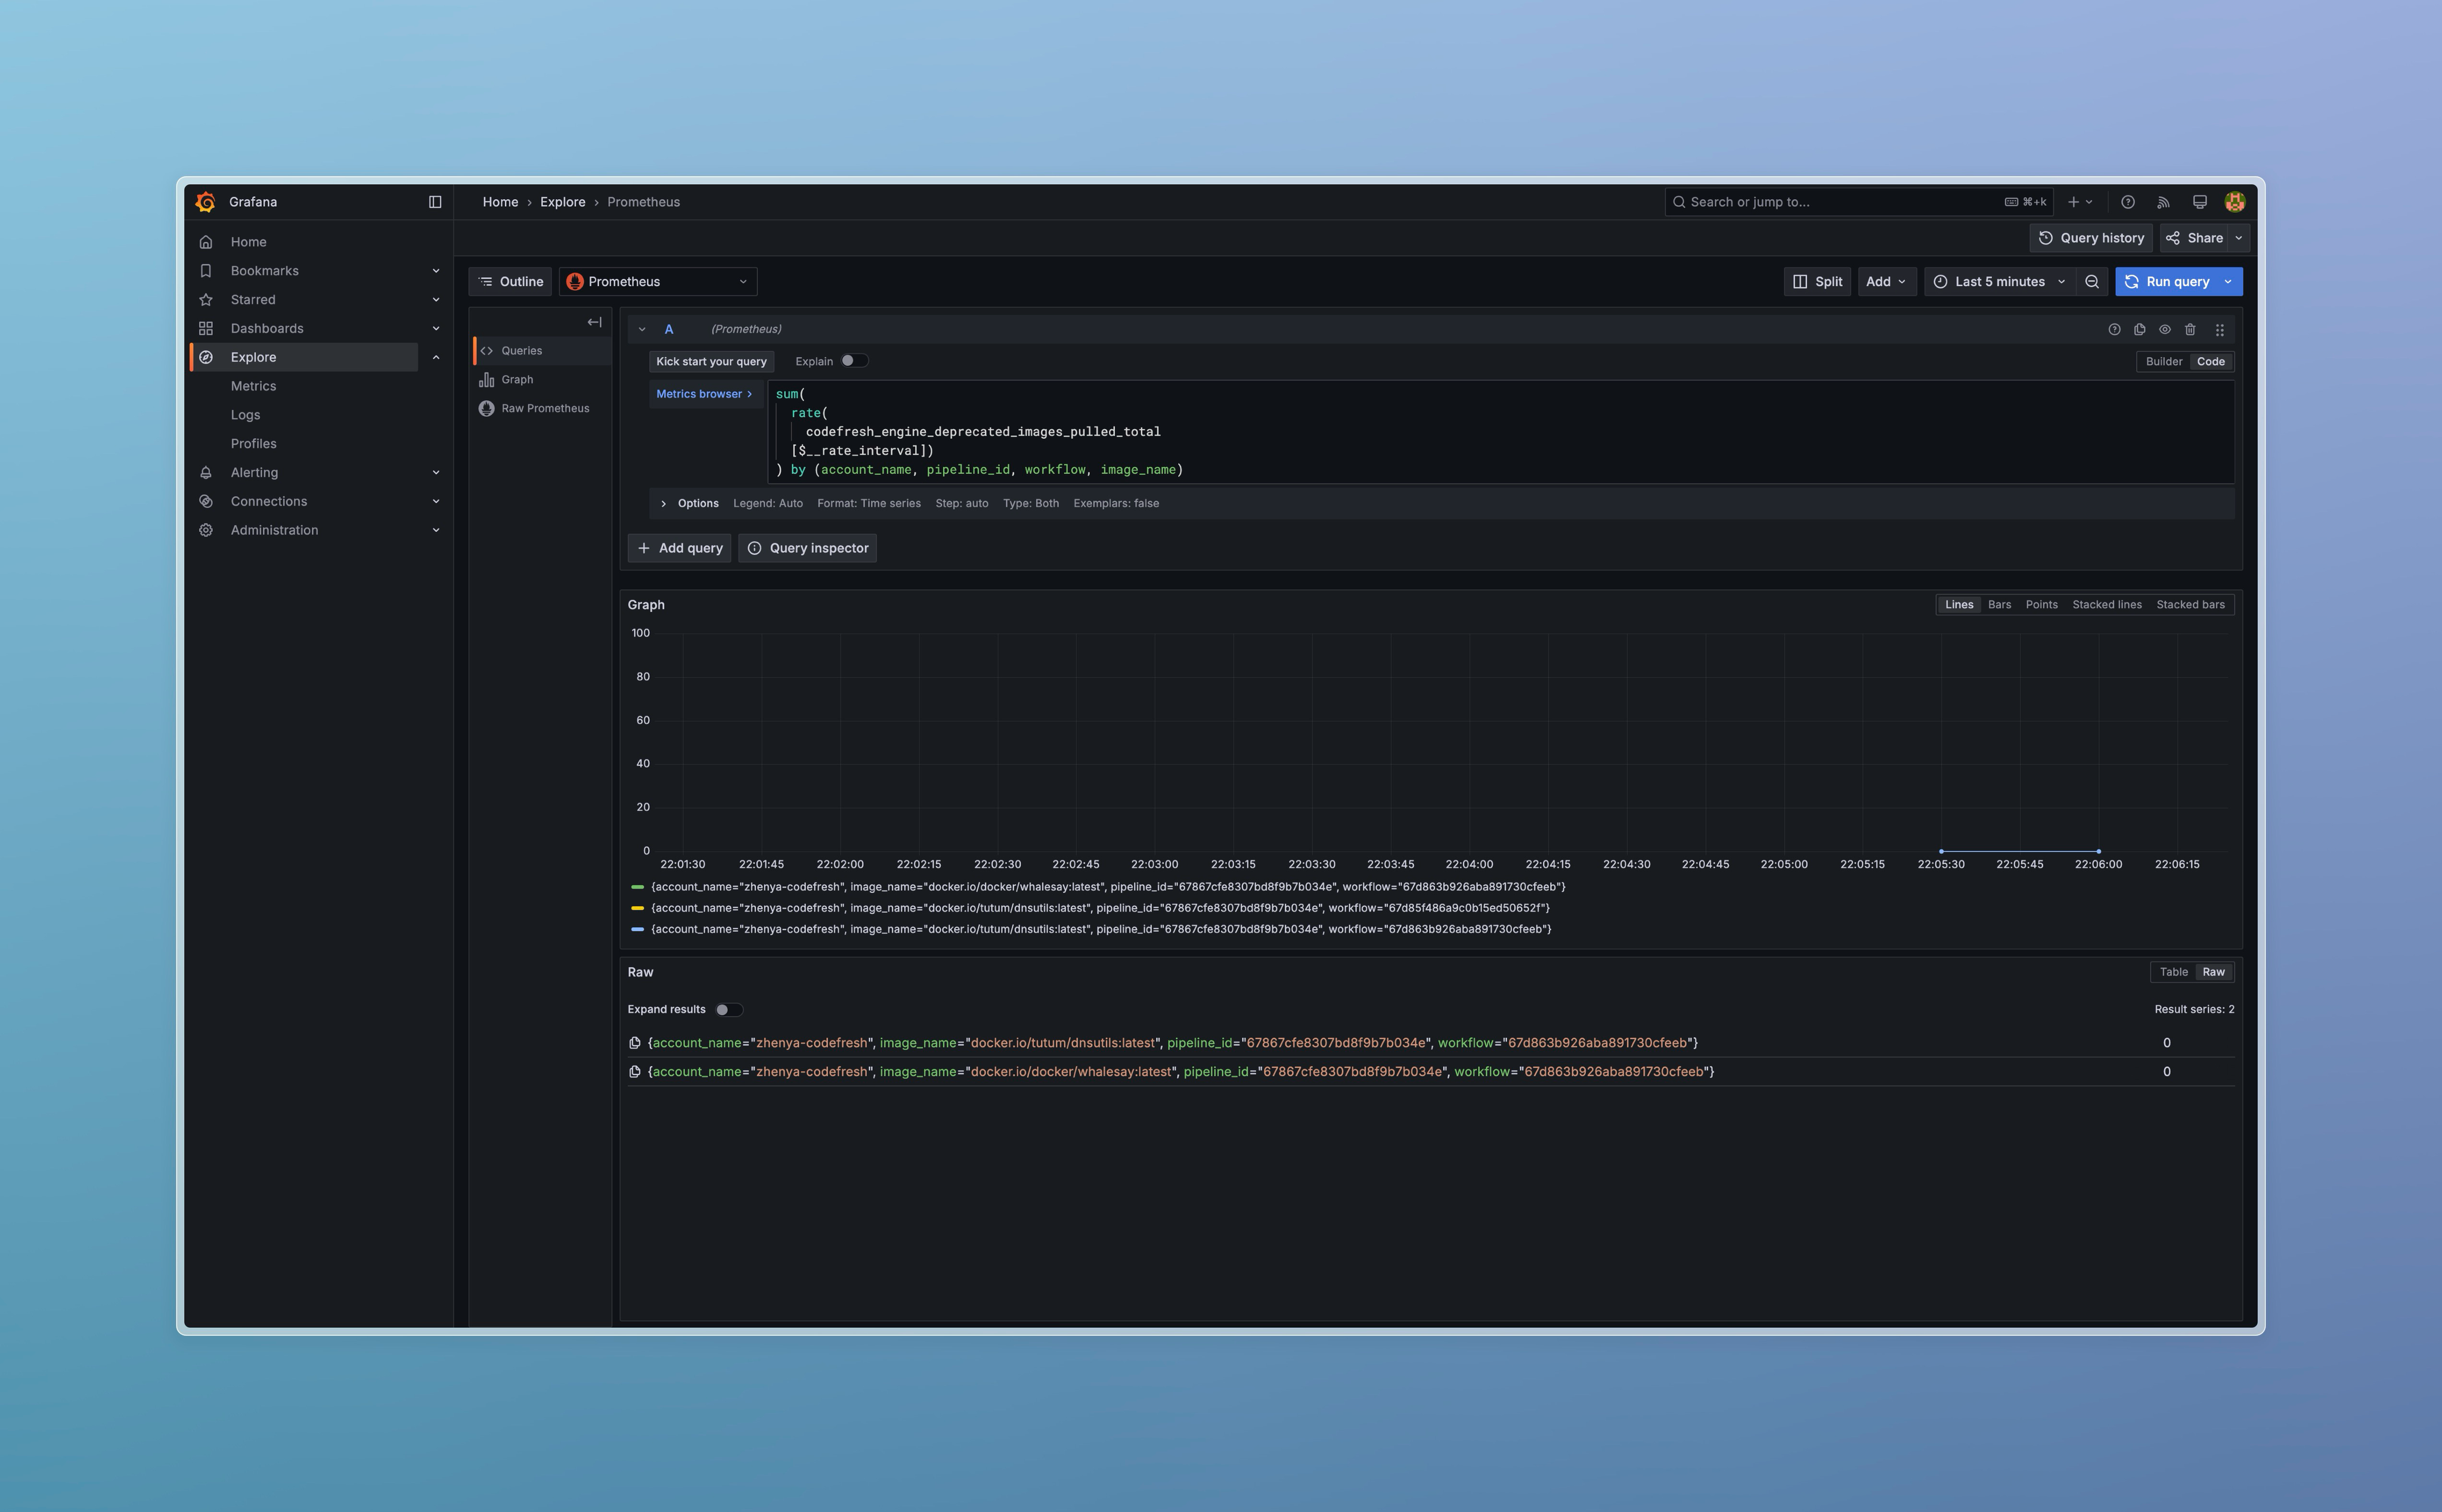
Deprecated images docker.io/tutum/dnsutils:latest and docker.io/docker/whalesay:latest has been pulled in Pipeline #67867cfe8307bd8f9b7b034e
http://docker.io/tutum/dnsutils:latest http://docker.io/docker/whalesay:latest