Monitoring Classic Runtime
How to monitor the Codefresh Classic Runtime
engine component
Modern versions of the Codefresh Classic Runtime (cf-runtime chart >=8.2.0, engine >=1.179.1) provide the engine component metrics in OpenTelemetry format, with the preferable push model.
You can still use the pull model by switching to the Prometheus Metrics Exporter, which is fully compatible with Prometheus. At the same time, we recommend using the default configuration, as it is better suited for the short-lived nature of Classic Builds and provides more precise and complete metrics.
To switch to the Prometheus Metrics Exporter, use the following values in the chart:
runtime:
  engine:
    env:
      OTEL_METRICS_EXPORTER: 'prometheus'
      METRICS_SCRAPE_TIMEOUT_MS: '<4×scrape_interval>' # On exit, wait <timeout>ms for the scrape before exiting
podMonitor:
  main:
    enabled: true # Enable PodMonitor for engine pods
Please refer to the cf-runtime Chart default values on Artifact Hub for more configuration options.
Resource attributes
By default, the engine resource has the following attributes:
| Attribute | Type | Description | Examples |
|---|---|---|---|
service.name |
string | The name of the engine component. |
cf-classic-engine |
service.namespace |
string | The namespace of the engine component. |
cf-classic-runtime |
service.version |
string | The version of the engine component; in format <image-tag>@<image-digest> |
1.179.1@sha256:37caef1e58f8d07ed76da753fb46eb59224e723495c1b9081d3ef7e0bc9449f9 |
cf.classic.runtime.name |
string | The name of the runtime of which this engine component is a part. |
my-runtime |
cf.classic.runtime.version |
string | The version of the runtime chart. | 8.2.0 |
Metrics
Default attributes
Attributes below are added to all metrics described in this section.
| Attribute | Type | Description | Examples |
|---|---|---|---|
cf.classic.build.id |
string | The ID of the build. | 6898c4e4bc5ecdb9f1f95c0c |
cf.classic.pipeline.id |
string | The ID of the pipeline to which the build belongs. | 6898c4ea6f064e824a33edc3 |
cf.classic.pipeline.name |
string | The name of the pipeline to which the build belongs; in format <project-name>/<pipeline-name>. |
my-project/my-pipeline |
cf.classic.account.id |
string | The ID of the Codefresh account in which the build is running. | 6898c4df2d142ffac1720fbf |
cf.classic.account.name |
string | The name of the Codefresh account in which the build is running. | my-account |
codefresh.classic.build.info
The metric is always emitted.
| Name | Instrument Type | Unit | Description |
|---|---|---|---|
codefresh.classic.build.info |
Gauge | — | Contains information about the classic build. |
| Attribute | Type | Description | Examples |
|---|---|---|---|
cf.classic.build.phase |
string enum | The phase of the build. | preparing | running | finalizing | failed | succeeded | terminated |
cf.classic.build.volume |
string enum | Indicates whether the new or reused volume has been assigned to the build. | new | reused |
codefresh.classic.build.start.timestamp
The metric is always emitted.
| Name | Instrument Type | Unit | Description |
|---|---|---|---|
codefresh.classic.build.start.timestamp |
Gauge | s |
Start time in unix timestamp for a build. |
codefresh.classic.build.completion.timestamp
The metric is always emitted.
| Name | Instrument Type | Unit | Description |
|---|---|---|---|
codefresh.classic.build.completion.timestamp |
Gauge | s |
Completion time in unix timestamp for a build. |
codefresh.classic.build.phase.start.timestamp
The metric is always emitted for every build phase.
| Name | Instrument Type | Unit | Description |
|---|---|---|---|
codefresh.classic.build.phase.start.timestamp |
Gauge | s |
Start time in unix timestamp for a build phase. |
| Attribute | Type | Description | Examples |
|---|---|---|---|
cf.classic.build.phase |
string enum | The phase of the build. | preparing | running | finalizing | failed | succeeded | terminated |
codefresh.classic.build.phase.completion.timestamp
The metric is always emitted for every build phase.
| Name | Instrument Type | Unit | Description |
|---|---|---|---|
codefresh.classic.build.phase.completion.timestamp |
Gauge | s |
Completion time in unix timestamp for a build phase. |
| Attribute | Type | Description | Examples |
|---|---|---|---|
cf.classic.build.phase |
string enum | The phase of the build. | preparing | running | finalizing | failed | succeeded | terminated |
codefresh.classic.build.step.info
The metric is always emitted for every build step.
| Name | Instrument Type | Unit | Description |
|---|---|---|---|
codefresh.classic.build.step.info |
Gauge | — | Contains information about the classic build step. |
| Attribute | Type | Description | Examples |
|---|---|---|---|
cf.classic.build.step.name |
string | The name of the step as defined in the pipeline YAML. Unique per build. | my-clone |
cf.classic.build.step.type |
string enum | The type of the step (for internal steps). | _internal:pre-step | _internal:post-step | _internal:init |
cf.classic.build.step.type |
string | The type of the step. | freestyle; build |
cf.classic.build.step.version |
string | The version of the step. | 1.0.0; latest |
cf.classic.build.step.phase |
string enum | The phase of the build step. | preparing | running | finalizing | failed | succeeded | terminated | finished |
codefresh.classic.build.step.start.timestamp
The metric is always emitted for every build step.
| Name | Instrument Type | Unit | Description |
|---|---|---|---|
codefresh.classic.build.step.start.timestamp |
Gauge | s |
Start time in unix timestamp for a build step. |
| Attribute | Type | Description | Examples |
|---|---|---|---|
cf.classic.build.step.name |
string | The name of the step as defined in the pipeline YAML. Unique per build. | my-clone |
codefresh.classic.build.step.completion.timestamp
The metric is always emitted for every build step.
| Name | Instrument Type | Unit | Description |
|---|---|---|---|
codefresh.classic.build.step.completion.timestamp |
Gauge | s |
Completion time in unix timestamp for a build step. |
| Attribute | Type | Description | Examples |
|---|---|---|---|
cf.classic.build.step.name |
string | The name of the step as defined in the pipeline YAML. Unique per build. | my-clone |
codefresh.classic.build.step.phase.start.timestamp
The metric is always emitted for every build step phase.
| Name | Instrument Type | Unit | Description |
|---|---|---|---|
codefresh.classic.build.step.phase.start.timestamp |
Gauge | s |
Start time in unix timestamp for a build step phase. |
| Attribute | Type | Description | Examples |
|---|---|---|---|
cf.classic.build.step.name |
string | The name of the step as defined in the pipeline YAML. Unique per build. | my-clone |
cf.classic.build.step.phase |
string enum | The phase of the build step. | preparing | running | finalizing | failed | succeeded | terminated | finished |
codefresh.classic.build.step.phase.completion.timestamp
The metric is always emitted for every build step phase.
| Name | Instrument Type | Unit | Description |
|---|---|---|---|
codefresh.classic.build.step.phase.completion.timestamp |
Gauge | s |
Completion time in unix timestamp for a build step phase. |
| Attribute | Type | Description | Examples |
|---|---|---|---|
cf.classic.build.step.name |
string | The name of the step as defined in the pipeline YAML. Unique per build. | my-clone |
cf.classic.build.step.phase |
string enum | The phase of the build step. | preparing | running | finalizing | failed | succeeded | terminated | finished |
codefresh.classic.build.step.cpu.time
The metric is emitted for every build step, unless the step was too short to collect Docker metrics.
Emitted for Linux builds only. Not emitted if dind component is rootless.
For steps of type build that are not using buildx with docker-container driver, this metric may be underreported.
| Name | Instrument Type | Unit | Description |
|---|---|---|---|
codefresh.classic.build.step.cpu.time |
Counter | s |
Cumulative cpu time consumed by step in seconds. |
| Attribute | Type | Description | Examples |
|---|---|---|---|
cf.classic.build.step.name |
string | The name of the step as defined in the pipeline YAML. Unique per build. | my-clone |
codefresh.classic.build.step.memory.usage
The metric is emitted for every build step, unless the step was too short to collect Docker metrics.
Emitted for Linux builds only. Not emitted if dind component is rootless.
For steps of type build that are not using buildx with docker-container driver, this metric may be underreported.
| Name | Instrument Type | Unit | Description |
|---|---|---|---|
codefresh.classic.build.step.memory.usage |
Gauge | By |
Current memory usage for step, including all memory regardless of when it was accessed. |
| Attribute | Type | Description | Examples |
|---|---|---|---|
cf.classic.build.step.name |
string | The name of the step as defined in the pipeline YAML. Unique per build. | my-clone |
codefresh.classic.build.step.memory.working_set
The metric is emitted for every build step, unless the step was too short to collect Docker metrics.
Emitted for Linux builds only. Not emitted if dind component is rootless.
For steps of type build that are not using buildx with docker-container driver, this metric may be underreported.
| Name | Instrument Type | Unit | Description |
|---|---|---|---|
codefresh.classic.build.step.memory.working_set |
Gauge | By |
Current working set for step. Calculated as the current memory usage minus inactive_file. |
| Attribute | Type | Description | Examples |
|---|---|---|---|
cf.classic.build.step.name |
string | The name of the step as defined in the pipeline YAML. Unique per build. | my-clone |
codefresh.classic.build.composition.info
The metric is emitted if the composition is present in build.
| Name | Instrument Type | Unit | Description |
|---|---|---|---|
codefresh.classic.build.composition.info |
Gauge | — | Contains information about the classic build composition. |
| Attribute | Type | Description | Examples |
|---|---|---|---|
cf.classic.build.composition.name |
string | The name of the build composition. Unique per build. | my-services |
cf.classic.build.composition.phase |
string enum | The phase of the build composition. | preparing | running | finalizing | finished |
codefresh.classic.build.composition.start.timestamp
The metric is emitted if the composition is present in build.
| Name | Instrument Type | Unit | Description |
|---|---|---|---|
codefresh.classic.build.composition.start.timestamp |
Gauge | s |
Start time in unix timestamp for a build composition. |
| Attribute | Type | Description | Examples |
|---|---|---|---|
cf.classic.build.composition.name |
string | The name of the build composition. Unique per build. | my-services |
codefresh.classic.build.composition.completion.timestamp
The metric is emitted if the composition is present in build.
| Name | Instrument Type | Unit | Description |
|---|---|---|---|
codefresh.classic.build.composition.completion.timestamp |
Gauge | s |
Completion time in unix timestamp for a build composition. |
codefresh.classic.build.composition.phase.start.timestamp
The metric is emitted if the composition is present in build.
| Name | Instrument Type | Unit | Description |
|---|---|---|---|
codefresh.classic.build.composition.phase.start.timestamp |
Gauge | s |
Start time in unix timestamp for a build composition phase. |
| Attribute | Type | Description | Examples |
|---|---|---|---|
cf.classic.build.composition.name |
string | The name of the build composition. Unique per build. | my-services |
cf.classic.build.composition.phase |
string enum | The phase of the build composition. | preparing | running | finalizing | finished |
codefresh.classic.build.composition.phase.completion.timestamp
The metric is emitted if the composition is present in build.
| Name | Instrument Type | Unit | Description |
|---|---|---|---|
codefresh.classic.build.composition.phase.completion.timestamp |
Gauge | s |
Completion time in unix timestamp for a build composition phase. |
| Attribute | Type | Description | Examples |
|---|---|---|---|
cf.classic.build.composition.name |
string | The name of the build composition. Unique per build. | my-services |
cf.classic.build.composition.phase |
string enum | The phase of the build composition. | preparing | running | finalizing | finished |
codefresh.classic.build.composition.task.info
The metric is emitted if the composition is present in build.
| Name | Instrument Type | Unit | Description |
|---|---|---|---|
codefresh.classic.build.composition.task.info |
Gauge | — | Contains information about the classic build composition task. |
| Attribute | Type | Description | Examples |
|---|---|---|---|
cf.classic.build.composition.name |
string | The name of the build composition. Unique per build. | my-services |
cf.classic.build.composition.task.name |
string | The name of the build composition task. Unique per build composition. | publishServicePorts; start; pullAll |
cf.classic.build.composition.task.phase |
string enum | The phase of the build composition task. | running | failed | succeeded |
codefresh.classic.build.composition.task.start.timestamp
The metric is emitted if the composition is present in build.
| Name | Instrument Type | Unit | Description |
|---|---|---|---|
codefresh.classic.build.composition.task.start.timestamp |
Gauge | s |
Start time in unix timestamp for a build composition task. |
| Attribute | Type | Description | Examples |
|---|---|---|---|
cf.classic.build.composition.name |
string | The name of the build composition. Unique per build. | my-services |
cf.classic.build.composition.task.name |
string | The name of the build composition task. Unique per build composition. | publishServicePorts; start; pullAll |
codefresh.classic.build.composition.task.completion.timestamp
The metric is emitted if the composition is present in build.
| Name | Instrument Type | Unit | Description |
|---|---|---|---|
codefresh.classic.build.composition.task.completion.timestamp |
Gauge | s |
Completion time in unix timestamp for a build composition task. |
| Attribute | Type | Description | Examples |
|---|---|---|---|
cf.classic.build.composition.name |
string | The name of the build composition. Unique per build. | my-services |
cf.classic.build.composition.task.name |
string | The name of the build composition task. Unique per build composition. | publishServicePorts; start; pullAll |
codefresh.classic.engine.docker.request_retries
The metric is emitted when the engine retries a request to the Docker daemon.
| Name | Instrument Type | Unit | Description |
|---|---|---|---|
codefresh.classic.engine.docker.request_retries |
Counter | {request_retry} |
Total number of retries when making requests to the Docker daemon. |
| Attribute | Type | Description | Examples |
|---|---|---|---|
docker.operation.name |
string | The name of the Docker operation under retry. | pull; listContainers |
docker.operation.error |
string | The error encountered during the Docker operation and caused retry. | ENOTFOUND; ECONNRESET |
codefresh.classic.engine.docker.request_retries.delay.time
The metric is emitted when the engine retries a request to the Docker daemon.
| Name | Instrument Type | Unit | Description |
|---|---|---|---|
codefresh.classic.engine.docker.request_retries.delay.time |
Counter | s |
Total delay in seconds caused by retries when making requests to the Docker daemon. |
| Attribute | Type | Description | Examples |
|---|---|---|---|
docker.operation.name |
string | The name of the Docker operation under retry. | pull; listContainers |
docker.operation.error |
string | The error encountered during the Docker operation and caused retry. | ENOTFOUND; ECONNRESET |
codefresh.classic.build.deprecated_images.pulled [removed in Runtime 9.0.0]
The metric is emitted when the engine pulls a deprecated “Docker Image Format v1” or “Docker Image manifest version 2, schema 1” image (Docker docs).
| Name | Instrument Type | Unit | Description |
|---|---|---|---|
codefresh.classic.build.deprecated_images.pulled |
Counter | {pull} |
Total number of deprecated “Docker Image Format v1” or “Docker Image manifest version 2, schema 1” image pulls. |
| Attribute | Type | Description | Examples |
|---|---|---|---|
docker.image.name |
string | The name of the Docker image. | alpine:latest |
Metrics for debugging
If needed, you can also collect various process metrics from the engine. These Prometheus metrics are available on port 9100 and controlled by the cf-runtime chart values runtime.engine.env.CF_TELEMETRY_PROMETHEUS_ENABLE and runtime.engine.env.CF_TELEMETRY_PROMETHEUS_ENABLE_PROCESS_METRICS.
These metrics are not needed for most users and disabled by default.
Grafana Dashboards
Codefresh provides ready-to-use Grafana dashboards that turn raw pipeline metrics into clear, actionable insights, helping teams move quickly from “something feels slow” to “here’s where the problem is.”
How to install
1. Download dashboard file (check links below)
2. Login to Grafana
3. Open “Dashboards → New → Import”
Required metrics
Dashboards are based on metrics emitted by Classic Hybrid Runtime. Please check the documentation to learn more.
Additionally, they require the following metrics:
container_memory_working_set_bytescontainer_cpu_usage_seconds_totalcontainer_cpu_cfs_periods_totalcontainer_cpu_cfs_throttled_periods_totalkube_pod_container_resource_requestskube_pod_container_resource_limits
Required labels
All metrics should have the following labels:
clusternamespacepod
Classic Pipelines — Overview
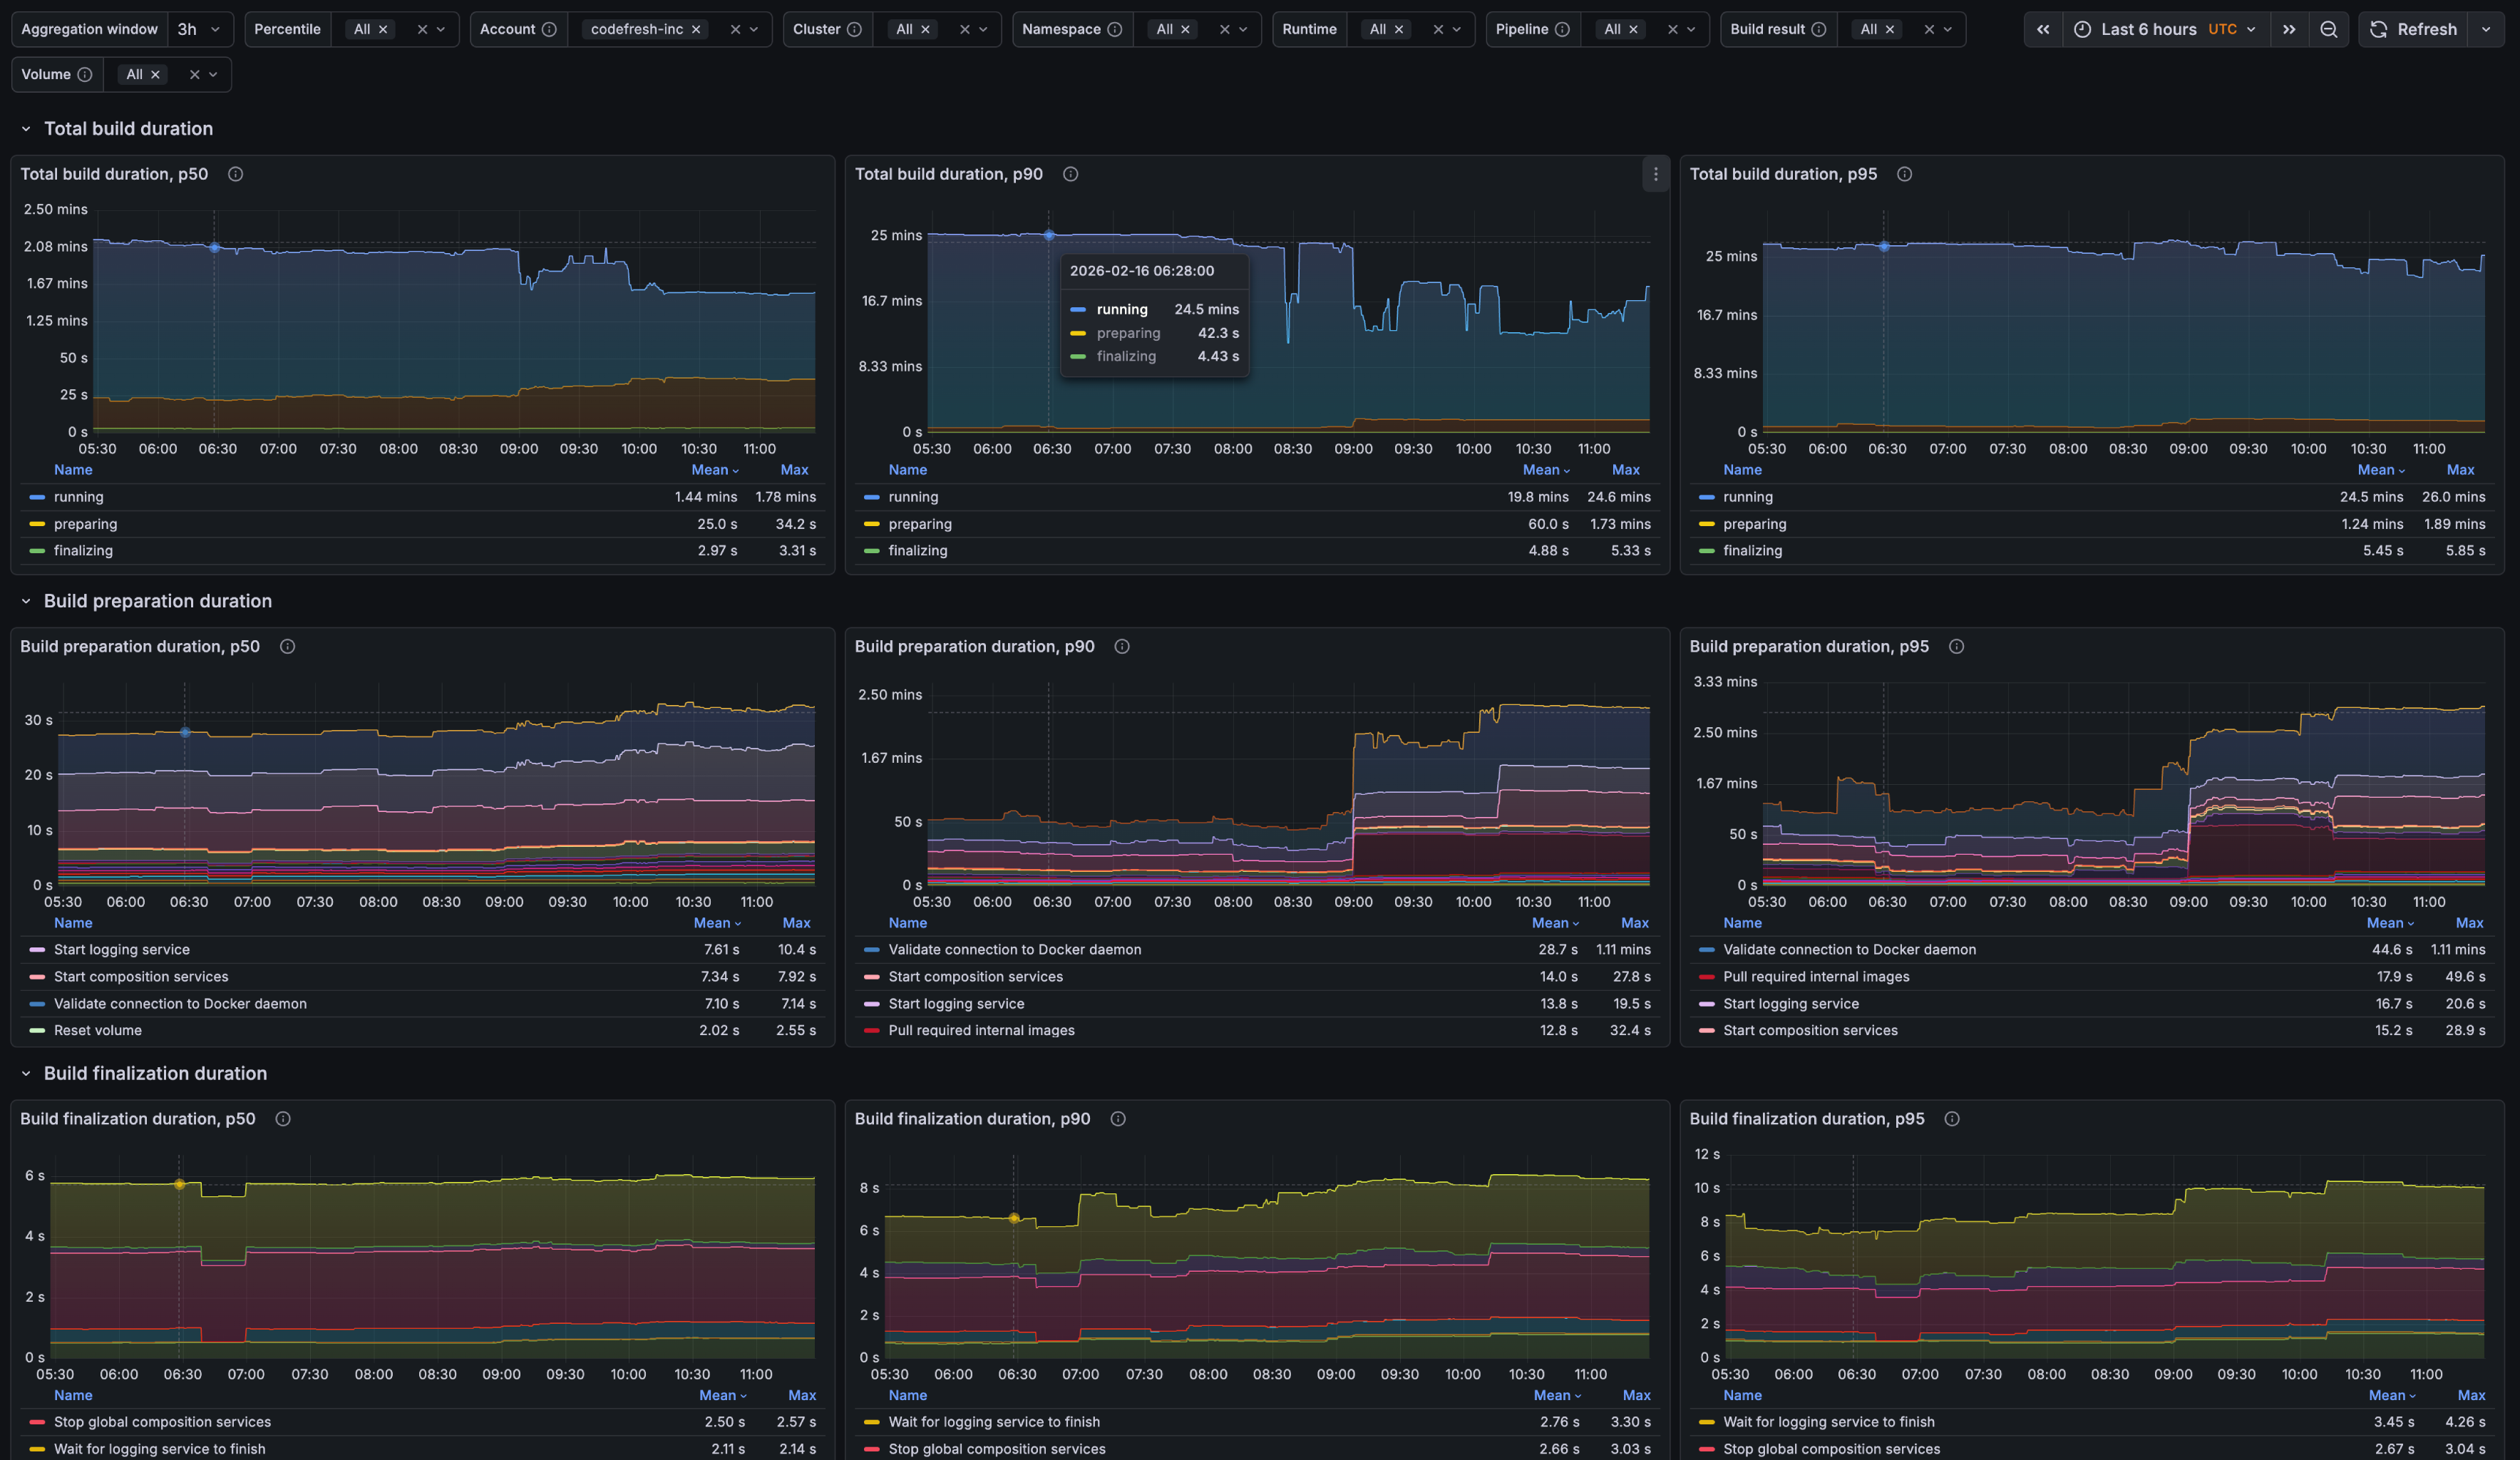
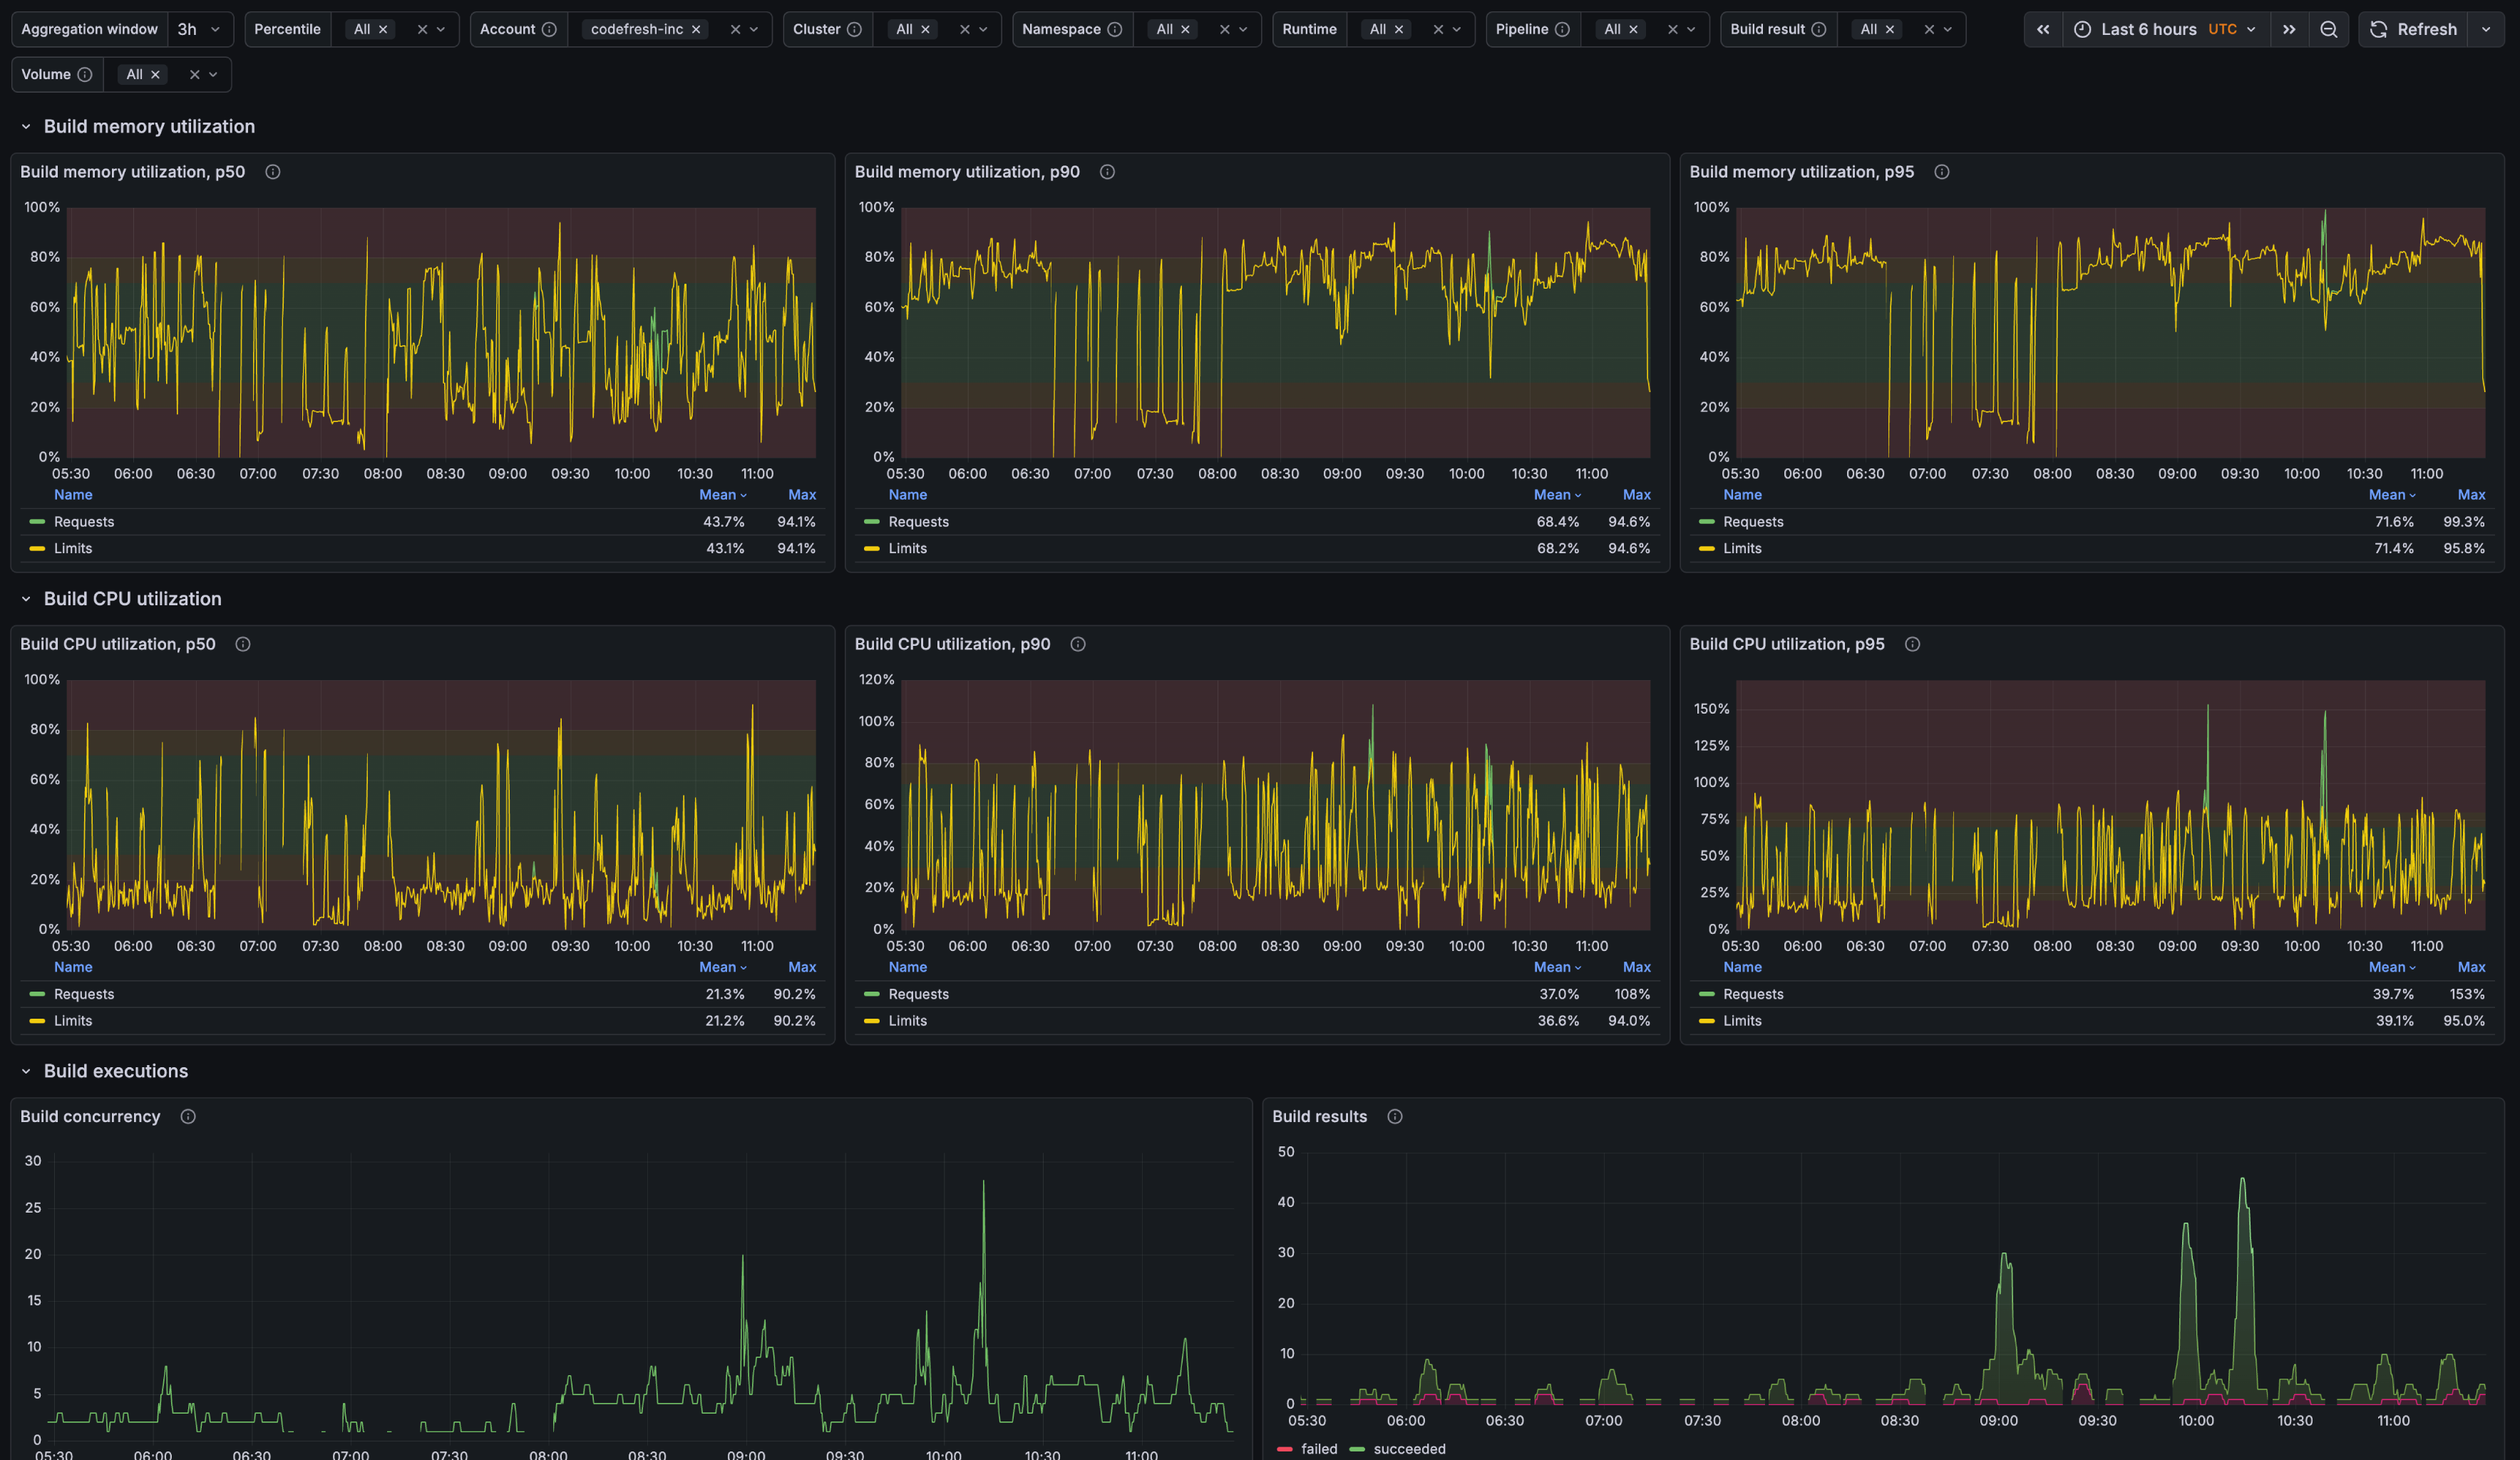
Download: grafana-classic-pipelines-overview.json
The “Classic Pipelines — Overview” dashboard is designed to help teams understand how their pipelines behave over time, rather than focusing on a single build in isolation. It provides a high-level view of performance trends, making it easier to spot gradual slowdowns, sudden regressions, or improvements introduced by recent changes.
Using this dashboard, teams can answer questions such as:
- How is build duration changing over time?
- What is causing delays during build initialization?
- Are resources allocated effectively for this pipeline?
Classic Build — Details
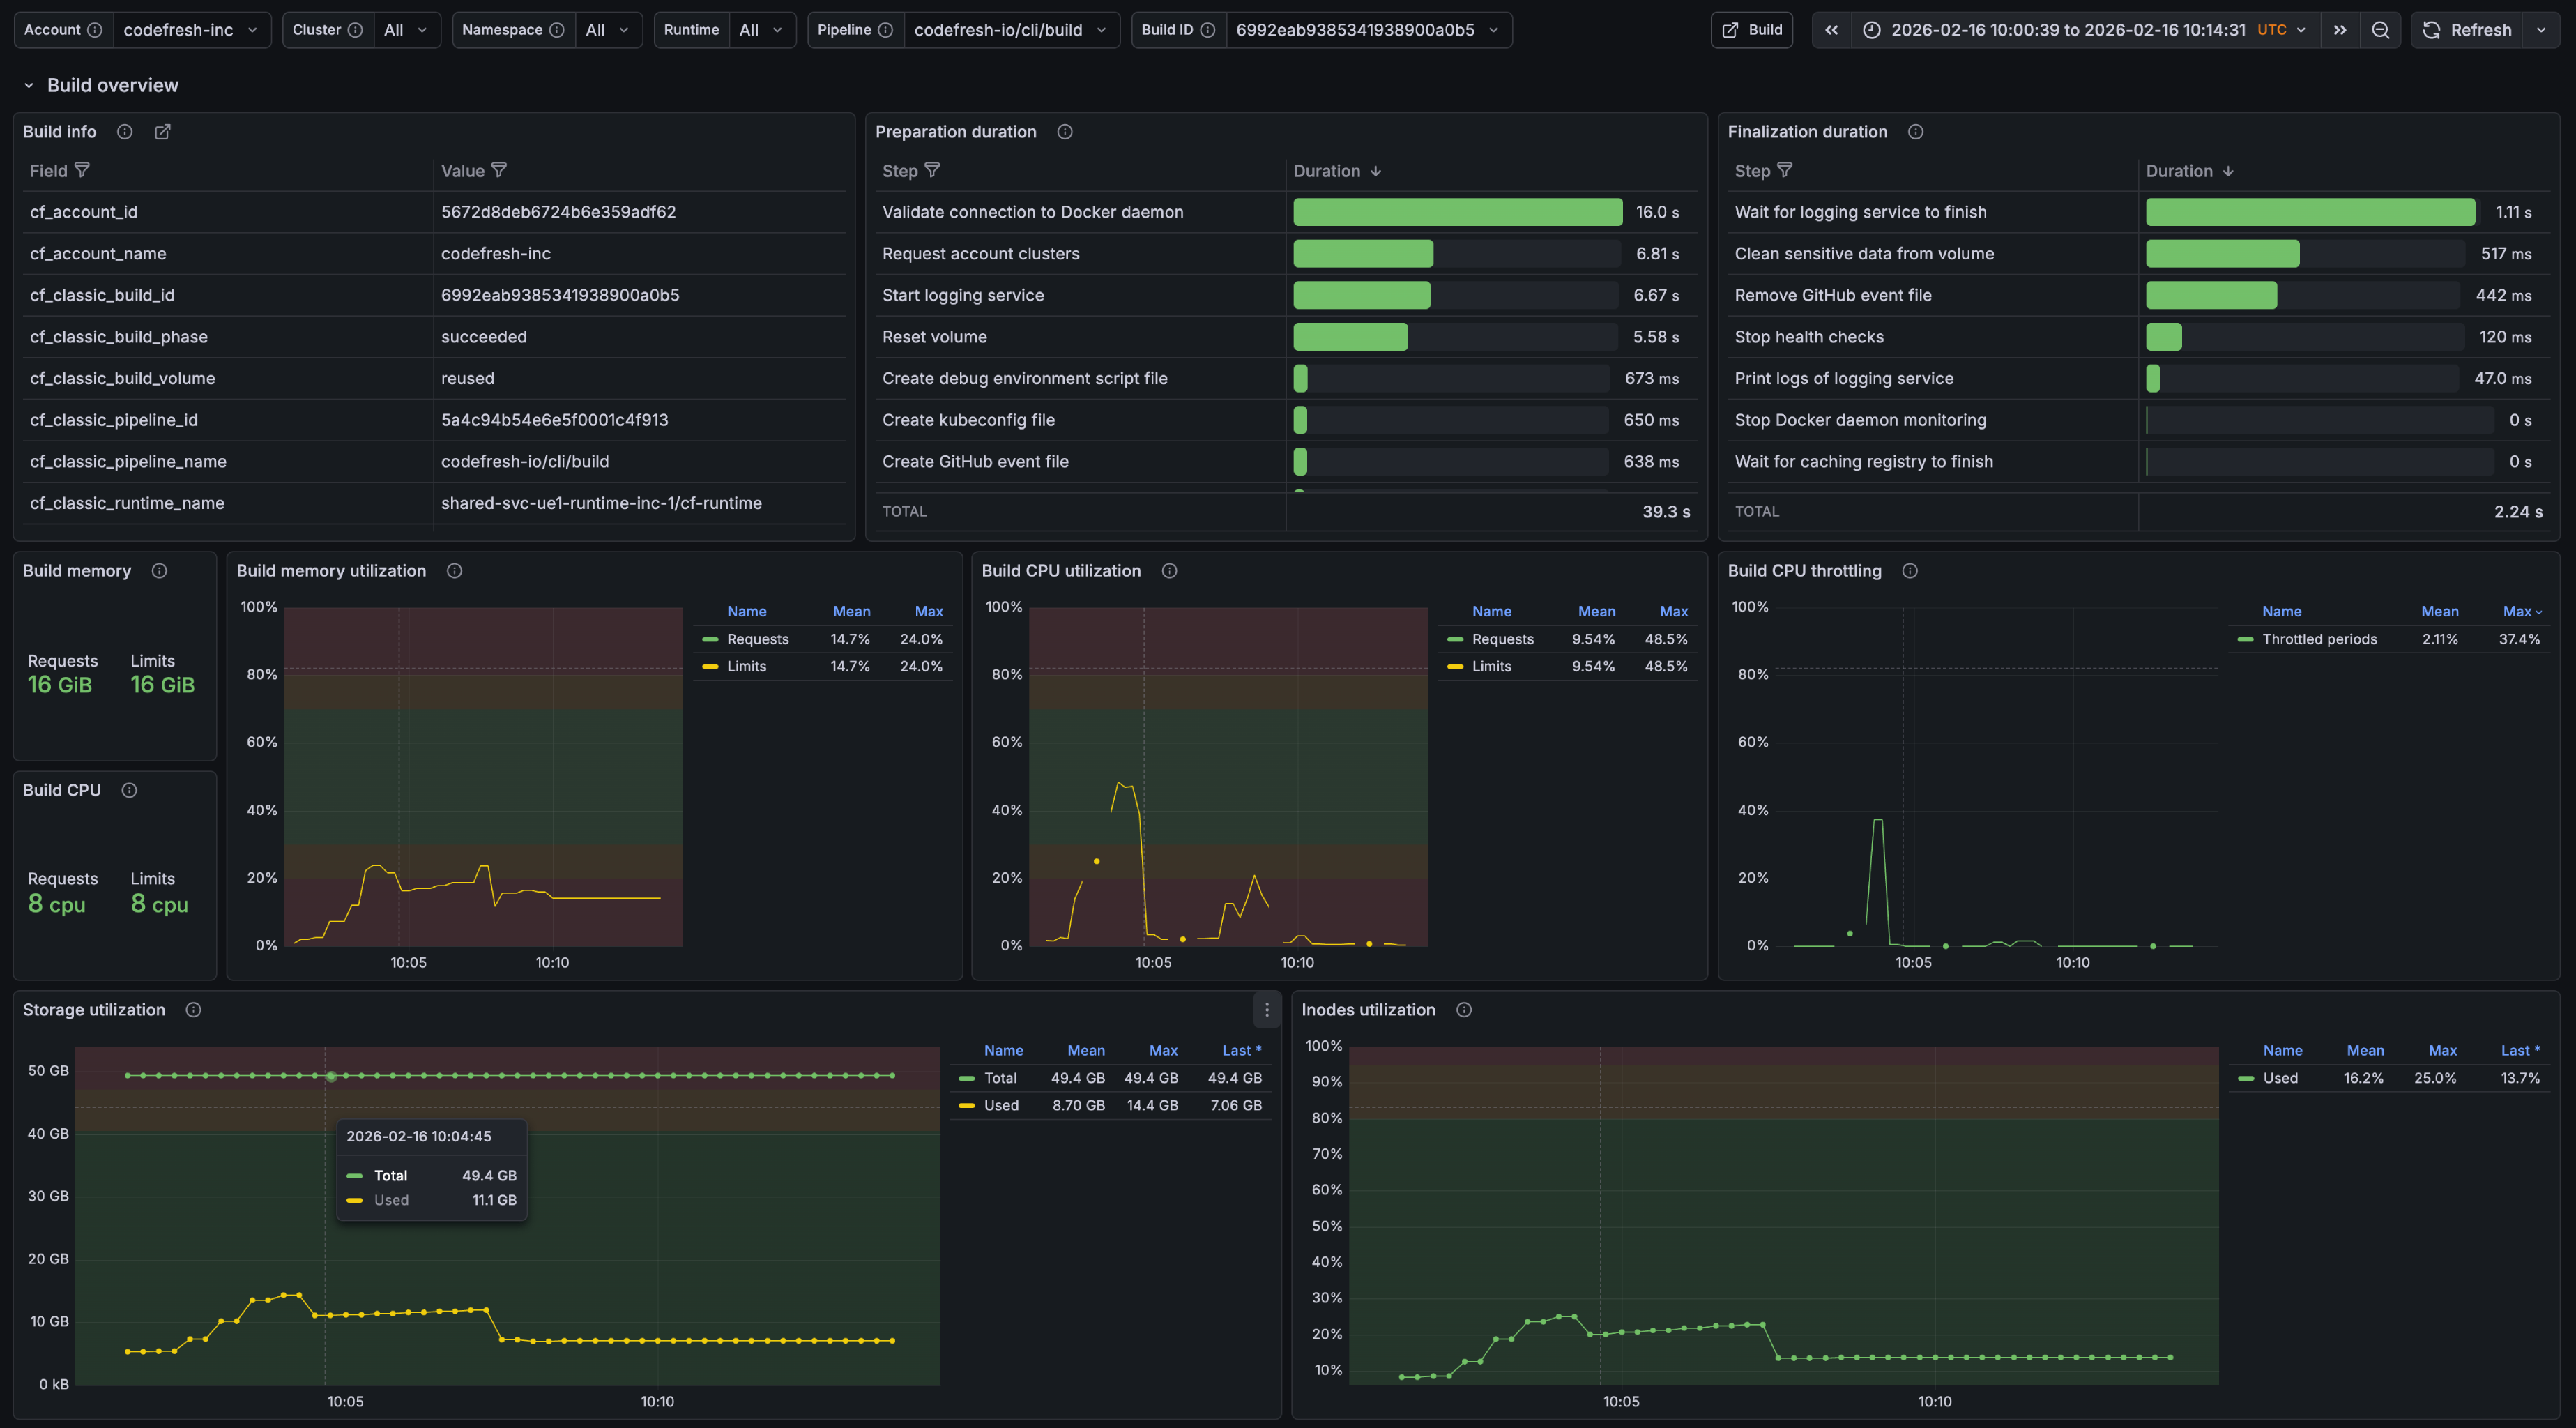
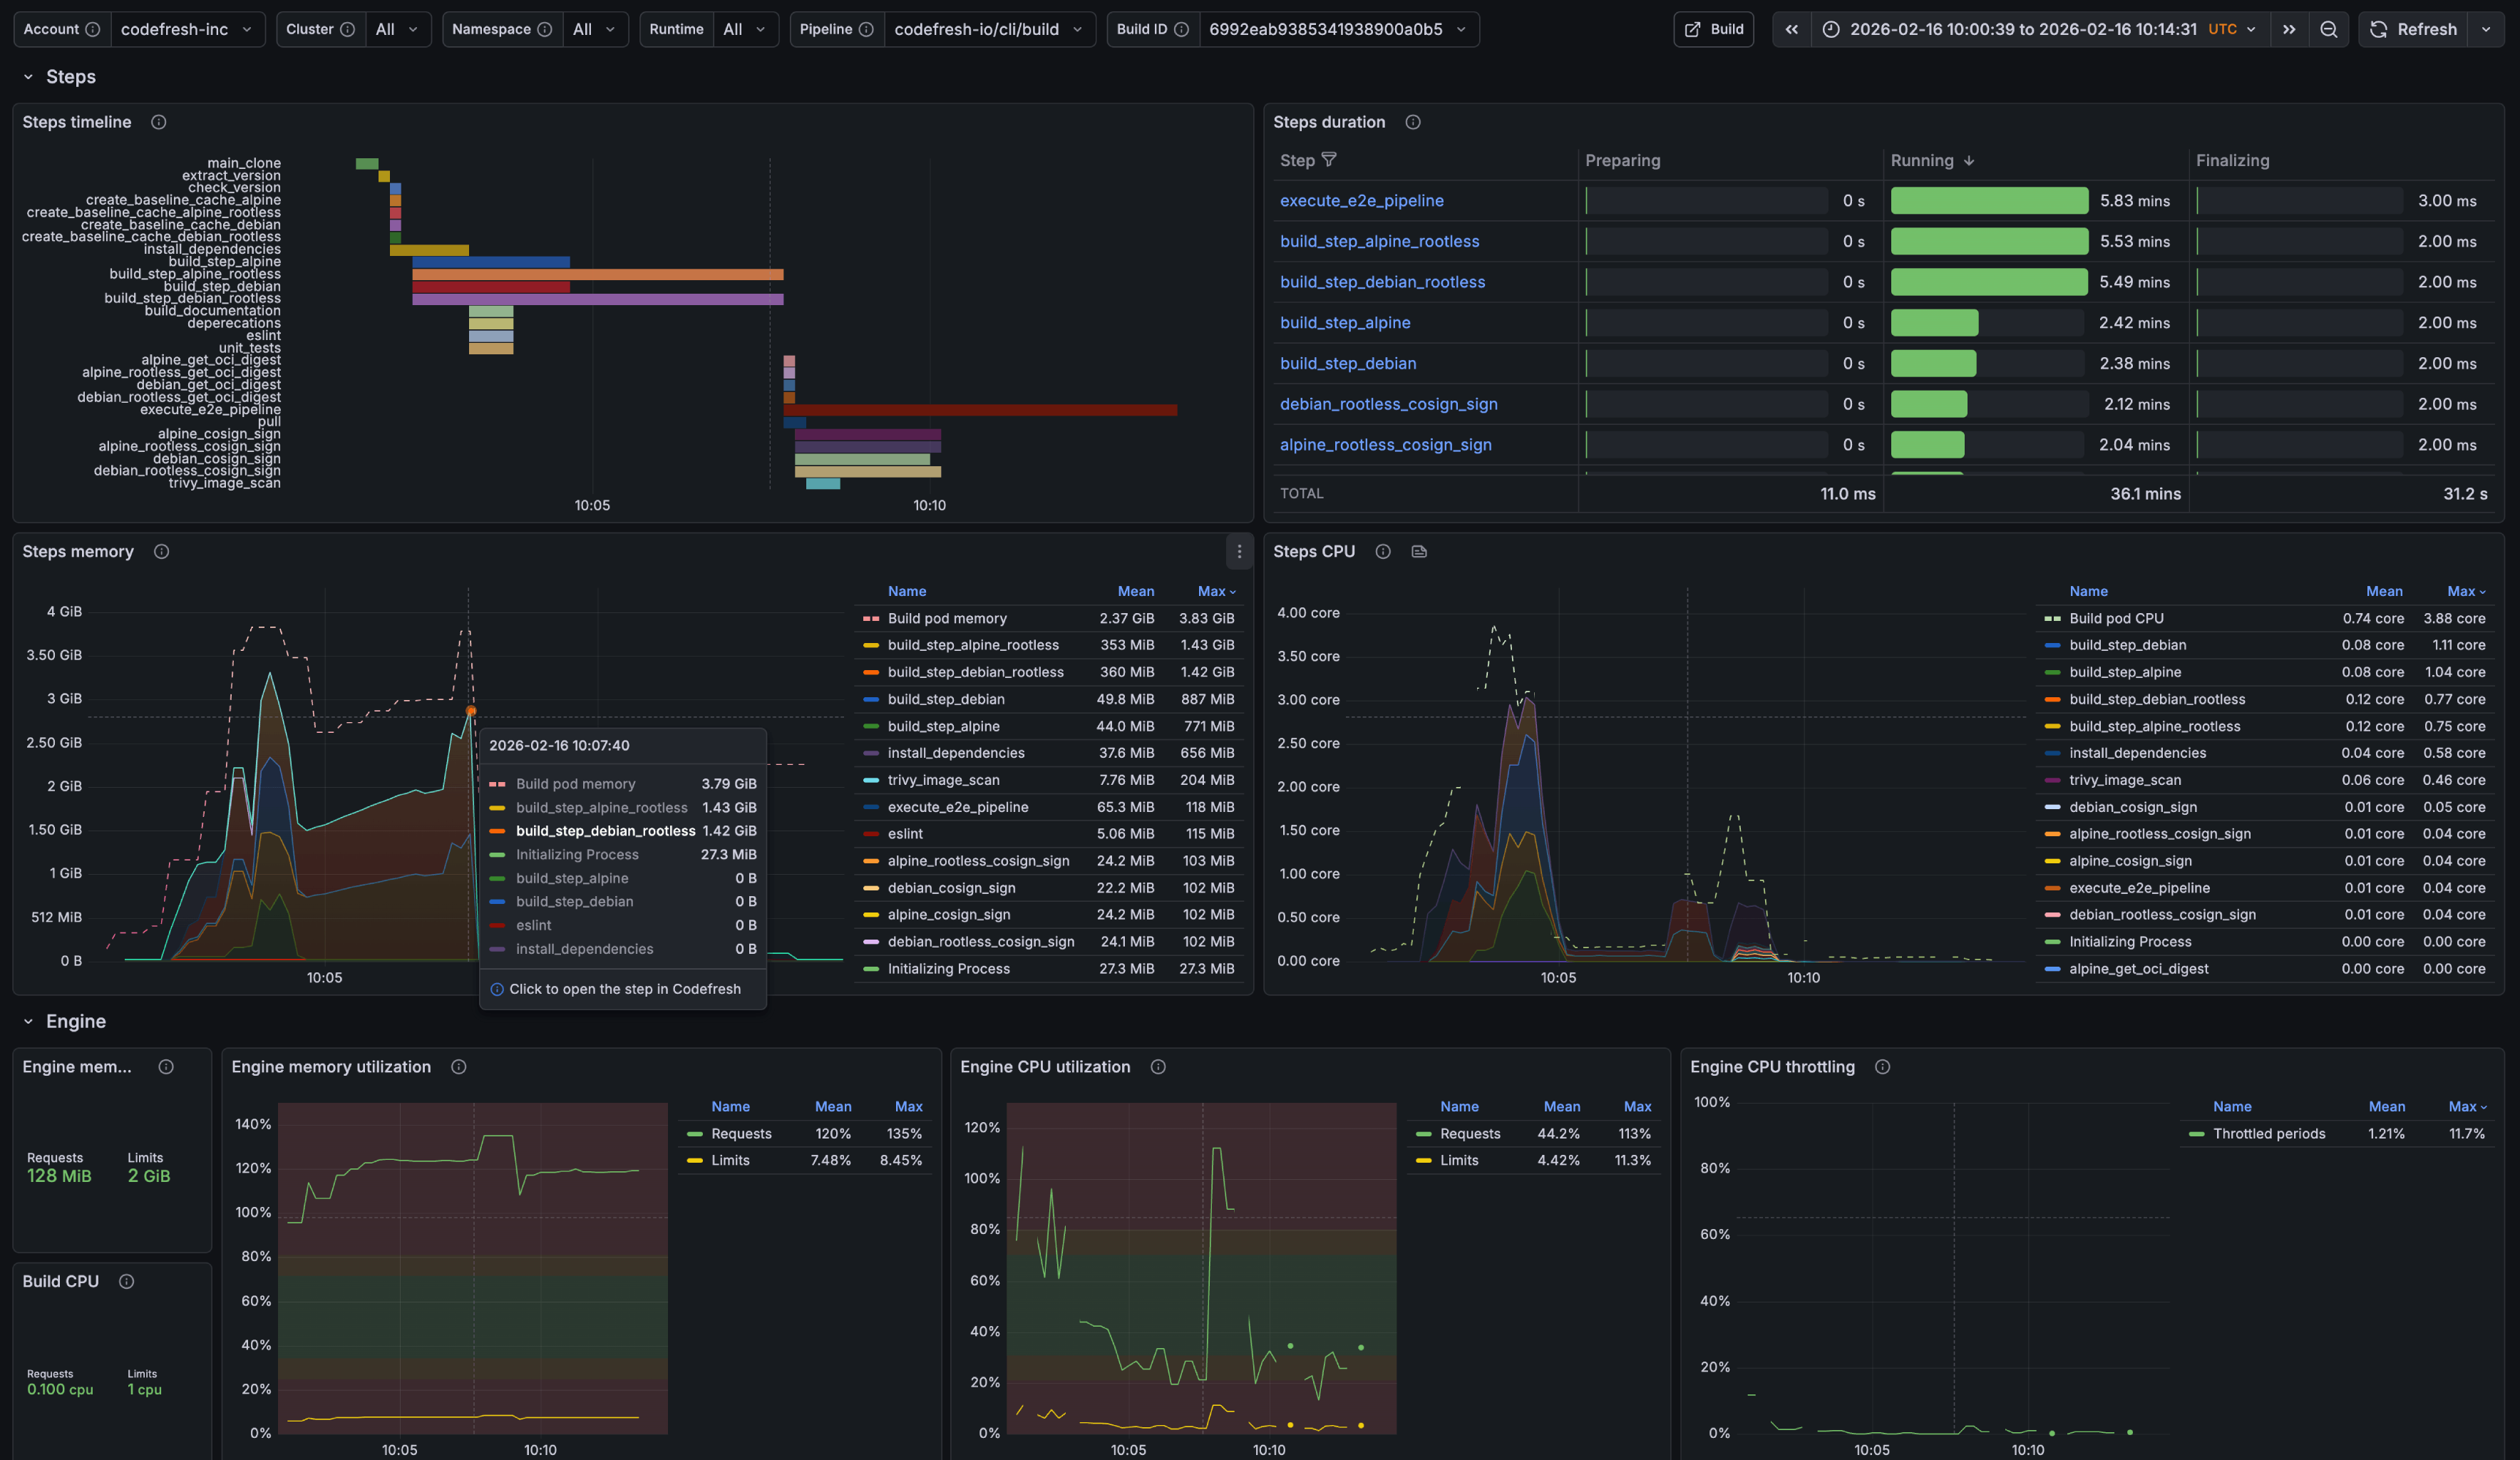
Download: grafana-classic-build-details.json
While the Pipeline Overview focuses on trends, The “Classic Build — Details” dashboard zooms in on individual builds to support faster troubleshooting and optimization. It is designed for moments when something looks off and teams need to understand exactly what happened during a specific execution.
With this level of detail, teams can answer questions such as:
- Which step consumes the most time or resources?
- Can the step structure be redesigned for faster execution?
- What caused delays during build bootstrap or startup?