Article Content
What Are the DORA Metrics?
The DevOps Research and Assessment (DORA) group published its State of DevOps report with insights from six years of research. It identified four key metrics for measuring DevOps performance, known as the DORA metrics:
- Deployment frequency
- Lead time for changes
- Change failure rate
- Mean time to recover
According to DORA’s research, high performing DevOps teams are those who optimize for these metrics. Organizations can use the metrics to measure performance of software development teams and improve the effectiveness of DevOps operations.
DORA started as an independent DevOps research group and was acquired by Google in 2018. Beyond the DORA Metrics, DORA provides DevOps best practices that help organizations improve software development and delivery through data-driven insights. DORA continues to publish DevOps studies and reports for the general public, and supports the Google Cloud team to improve software delivery for Google customers.
This is part of our series of articles about Software Deployment.
Why Are DORA Metrics Important for DevOps?
There is a need for a clear framework to define and measure the performance of DevOps teams. In the past, each organization or team selected its own metrics, making it difficult to benchmark an organization’s performance, compare performance between teams, or identify trends over time.
The DORA metrics provide a standard framework that helps DevOps and engineering leaders measure software delivery throughput (speed) and reliability (quality). They enable development teams to understand their current performance and take actions to deliver better software, faster. For leadership at software development organizations, these metrics provide specific data to measure their organization’s DevOps performance, report to management, and suggest improvements.
Another aspect of DORA metrics is they can help the organization identify if development teams are meeting customer requirements. Better metrics mean that customers are more satisfied with software releases, and DevOps processes provide more business value.
The 4 DORA Metrics
DORA Group research found that the most successful DevOps teams are those who optimize for the following metrics:
1. Deployment Frequency
This metric refers to how often an organization deploys code to production or to end users. Successful teams deploy on-demand, often multiple times per day, while underperforming teams deploy monthly or even once every several months.
This metric stresses the value of continuous development, which implies a high frequency of deployment. Teams should aim to deploy on-demand to get consistent feedback and deliver value faster to end users.
Deployment frequency might be defined differently in different organizations, depending on what is considered a successful deployment.
Related content: Read our guide to continuous deployment
2. Change Lead Time
This metric measures the total time between the receipt of a change request and deployment of the change to production, meaning it is delivered to the customer. Delivery cycles help understand the effectiveness of the development process. Long lead times (typically measured in weeks) can be the result of process inefficiencies or bottlenecks in the development or deployment pipeline. Good lead times (typically around 15 minutes) indicate an efficient development process.
Related content: Read our guide to the CI/CD pipeline
3. Change Failure Rate
The change failure rate measures the rate at which changes in production result in a rollback, failure, or other production incident. This measures the quality of code teams are deploying to production. The lower the percentage the better, with the ultimate goal being to improve failure rate over time as skills and processes improve. DORA research shows high performing DevOps teams have a change failure rate of 0-15%.
4. Mean Time to Recover
This metric measures the time it takes for a service to recover from a failure. In all DevOps teams, no matter how effective, unplanned outages and incidents will happen. Because failures are unavoidable, the time it takes to restore a system or application is critical to DevOps success.
When companies have short recovery times, leadership has more confidence to support innovation. This creates a competitive advantage and improves business profits. On the contrary, when failure is expensive and difficult to recover from, leadership will tend to be more conservative and inhibit new development.
This metric is important because it encourages engineers to build more robust systems. This is usually calculated by tracking the average time from reporting a bug to deploying a bug fix. According to DORA research, successful teams have an MTTR of around five minutes, while MTTR of hours or more is considered sub-par.
The following image shows the typical values for each of the DORA metrics for Elite vs. High, Medium, and Low-performing DevOps organizations.
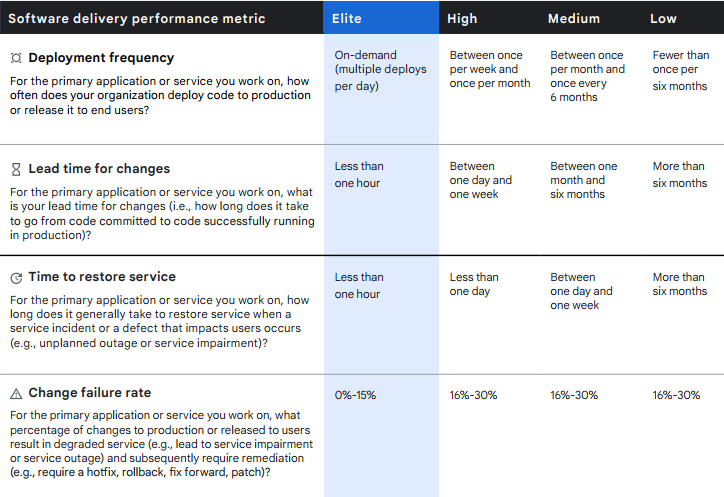
Image Source: 2021 State of DevOps – Software Delivery Performance Metric
Calculating the DORA Metrics
Deployment Frequency
Deployment frequency is the easiest metric to collect. However, it can be tricky to group frequency numbers. It would seem natural to look at daily deployment volume and take an average of deployments throughout the week, but this would measure deployment volume, not frequency.
The DORA Group recommends dividing deployment frequency into buckets. For example, if the median number of successful deployments per week is more than three, the organization falls into the Daily deployment bucket. If the organization deploys successfully on more than 5 out of 10 weeks, meaning it deploys on most weeks, it would fall into the Weekly deployment bucket.
Another key factor is what constitutes a successful deployment. If a canary deployment is exposed to only 5% of traffic, is it still considered a successful deployment? If a deployment runs successfully for several days and then experiences an issue, is it considered successful or not? The definition will depend on the specific organization’s goals.
Change Lead Time
In order to calculate the change lead time metrics, you need two pieces of data:
- When commits occur
- When deployments occur that include a specific commit
In other words, for each deployment, you need to maintain a list of all the changes included in it, where each change is mapped back to the SHA identifier of a specific commit. You can then join this list to the changes table, compare timestamps, and calculate the lead time.
Change Failure Rate
To calculate the change failure rate, you need to take two factors into account:
- Total number of deployments attempted
- Deployments that failed in production
In order to count deployments that failed in production, you need to track deployment incidents. These might be logged in a simple spreadsheet, bug tracking systems, a tool like GitHub incidents, etc. Wherever the incident data is stored, the important thing is to have each incident mapped to an ID of a deployment. This lets you identify the percentage of deployments that had at least one incident—resulting in the change failure rate.
This is possibly the most controversial of the DORA metrics, because there is no universal definition of what a successful or failed deployment means.
Mean Time to Recover
To measure mean time to recovery, you need to know the time an incident was created and the time a new deployment occurred that resolved the incident. Like the change failure rate metric, this data can be retrieved from any spreadsheet or incident management system, as long as each incident maps back to a deployment.
Tracking and Reporting the DORA Metrics with Codefresh
Codefresh is a CI/CD platform that lets you manage DevOps pipelines while consistently measuring the DORA metrics.
To view Dora metrics, In the Codefresh UI, click DORA Metrics in the left navigation.
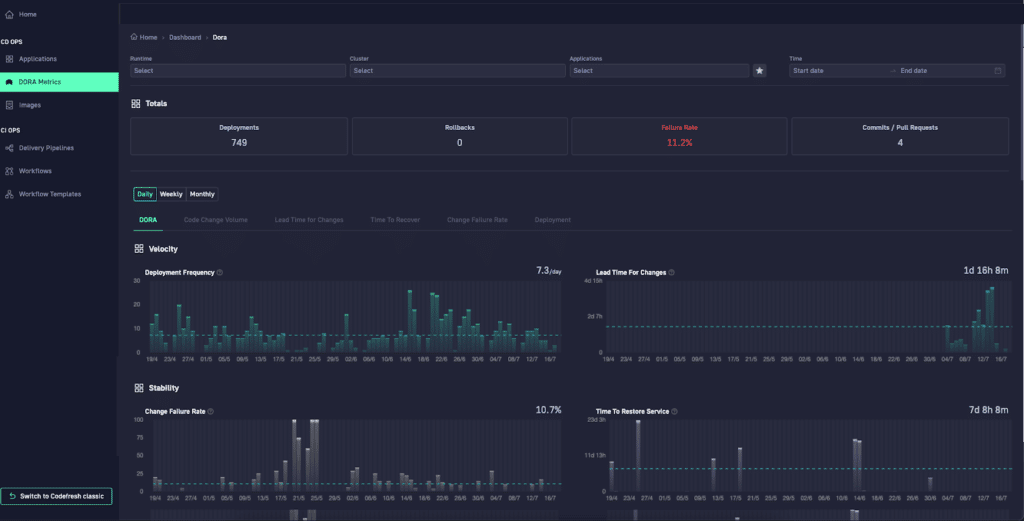
You can use filters to define the exact subset of applications you want to measure. All filters support auto-complete and multi-select. You can compare applications from selected runtimes, entire Kubernetes clusters, and specific applications. All these can be viewed for a specific timeframe, and you can select daily, weekly, or monthly granularity.
The Totals bar shows the number of deployments, rollbacks, commits/pull requests, and the failure rate for the selected group of applications. Below, you can see the charts for all four DORA metrics:
- Deployment Frequency – frequency of deployments of any kind, successful or failed.
- Change Failure Rate – failure or rollback rate in percentage for deployments. Derived by dividing the failed/rollback deployments by the total number of deployments. Failed deployments are Argo CD deployments that lead to a sync state of Degraded.
- Lead Time for Changes – average number of days from the first commit for a pull request until the deployment date for the same pull request.
- Time to Restore Service – average number of hours between the change in status to Degraded or Unhealthy after deployment, and back to Healthy.

The World’s Most Modern CI/CD Platform
A next generation CI/CD platform designed for cloud-native applications, offering dynamic builds, progressive delivery, and much more.
Check It Out