My side project is an app-in-progress that was Dockerized from the start by its original developer. As a total Docker novice, I am failing often and learning as I go by inspecting logs and troubleshooting.
As I got started inspecting and storing my logs, I encountered two Docker-specific problems:
- Docker is many small services, generating more logs than I can easily inspect…So in all of this noise, what information do I need in order to troubleshoot?
- Docker is composed of isolated environments with isolated logs…So how do I synthesize them with meaningful context and metadata?
I’ll answer these two questions below.
In all of the log noise, what information do I need in order to troubleshoot?
Christian Beedgen’s presentation, Comprehensive Monitoring for Docker, gave me a clear, high-level understanding of the information I should collect to ensure I am not missing anything.
- Events: track each build event from start to runtime to stop—by container.
- Configuration: track config at each stage in the build cycle—by container.
- Logs: tracking running processes in all containers—by container.
-
Statistics: the stats API call returns runtime statistics. Track this by container.
-
Host and daemon logs: track host, daemon and container interactions…by container.
Note that unlike most *nix systems, there is no single source for Docker logs. Each container is isolated and generates its own separate logs. Maintaining the “by container” separation in metadata allows me to troubleshoot each particular container, but I also need to collect everything in one stream, as the interactions are also important in integration testing and in prod runs.
I could collect all of this in each container as a volume and send the logs to a centralized monitoring service like Elastic Search, Sumo Logic or Splunk. I may begin this process soon, and it’s certainly an effective (if not absolutely necessary step) for troubleshooting a mature production environment.
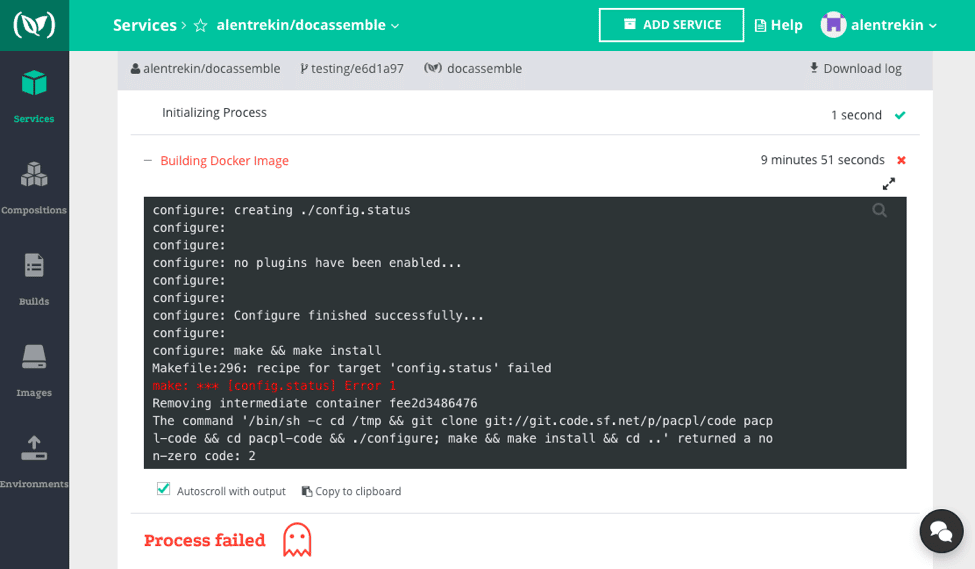
But Docker services can be very verbose. My first failed build generated 186 KB of logs, and I ran seven more builds that night. To get to the conf error in the build below, I would have needed to index this data, ensure it was tagged by container and pay for storage.
Adding any automated testing and deployment would quickly bump up my indexing amount, and supply some metadata tracking and dashboarding problems (that are not worth solving until I need real-time alerting).
How do I synthesize isolated environments and isolated logs with meaningful context and metadata?
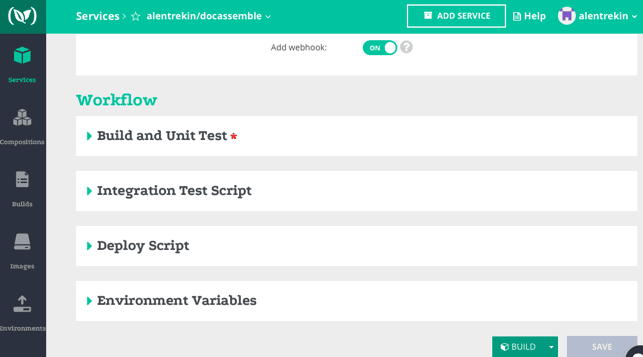
I started testing with a new service, Codefresh, which after a few builds, felt like Evernote for containers. It categorizes by Docker objects—Environment | Image | Builds | Composition | Services—and lays out the testing lifecycle in a workflow map:
My Docker files and logs are kept alongside each build, and when a build is triggered, the logs begin scrolling in real-time. Of course, the logs are the same as if I had called ‘docker log’ and collected them at stdout, but there is nothing for me to tag or organize. Instead, in the build above, I saw this config.status error:
configure: make && make install
Makefile:296: recipe for target ‘config.status’ failed
make: *** [config.status] Error 1
Then I began troubleshooting before my app failed to launch. While I still plan to build a log- monitoring service for real-time issues, the Codefresh approach has given me meaningful context and metadata at build and test.
For more in-depth reading, consider checking out:
- Martin Fowler’s short post on the “microservice premium,” or the cost of doing Docker.
- This stack overflow thread explores and explains the Docker filesystem.
- Nathan Leclaire at Docker narrates his Docker + ELK monitoring journey.
- Mark Betz’ 10 tips for Debugging Docker Containers is playful and to the point.


