If you use Kubernetes in production, you should already know that monitoring and logging solutions are essentials if you want to make sure that your cluster is healthy at all times.
Lack of computing resources and capacity misconfigurations are one of the most common causes of failed deployments. Especially if you are an operator, you always need to know the load of your cluster in order to perform capacity planning and setup autoscaling.
There are many monitoring solutions for Kubernetes but one of the simplest ones is Netdata. Today I will show you how you can monitor your Kubernetes cluster with zero configuration.
Get monitoring dashboards out of the box
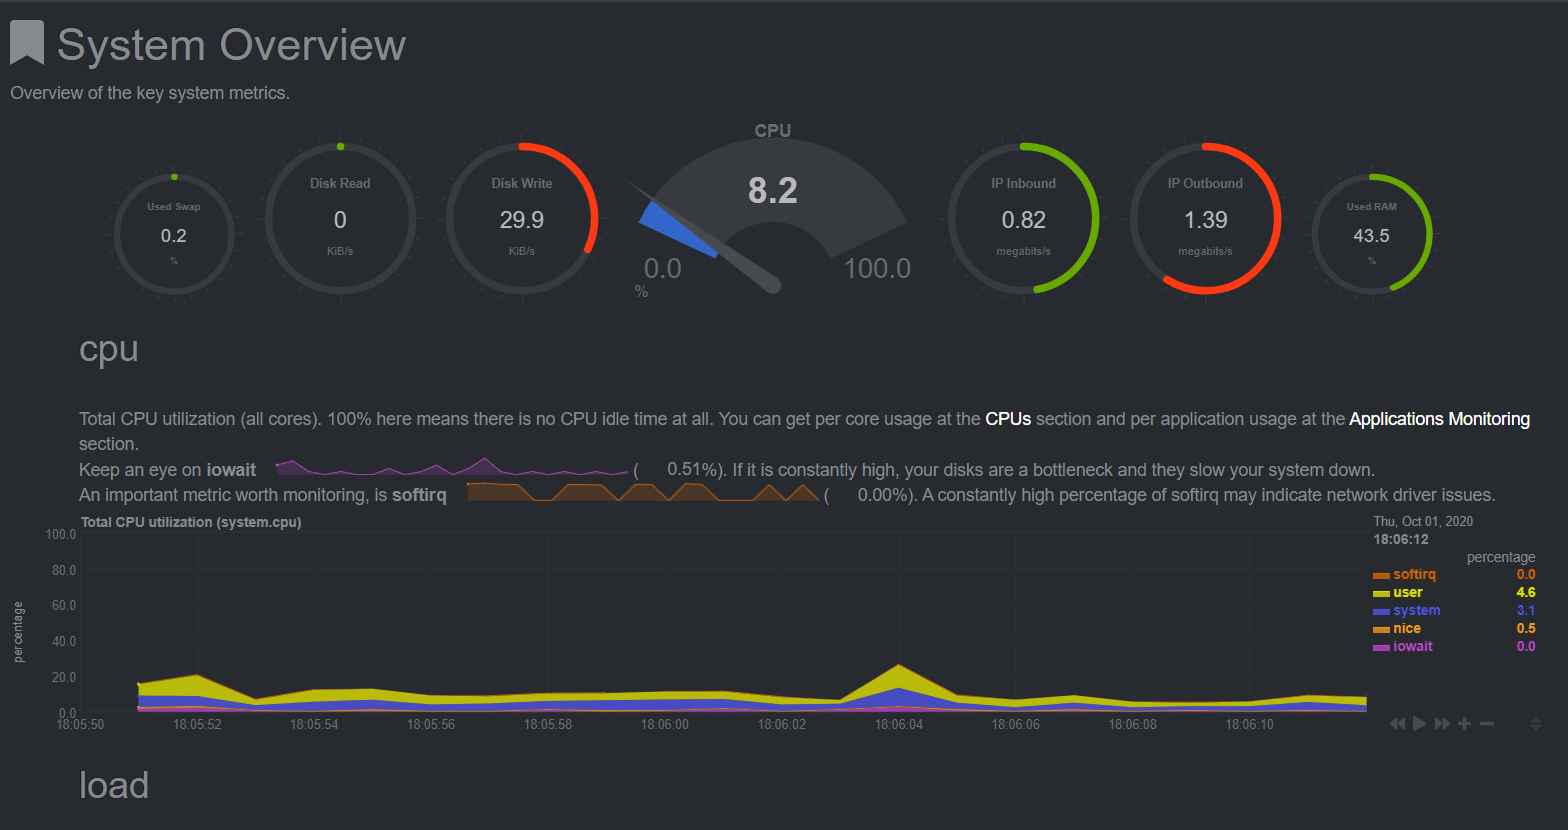
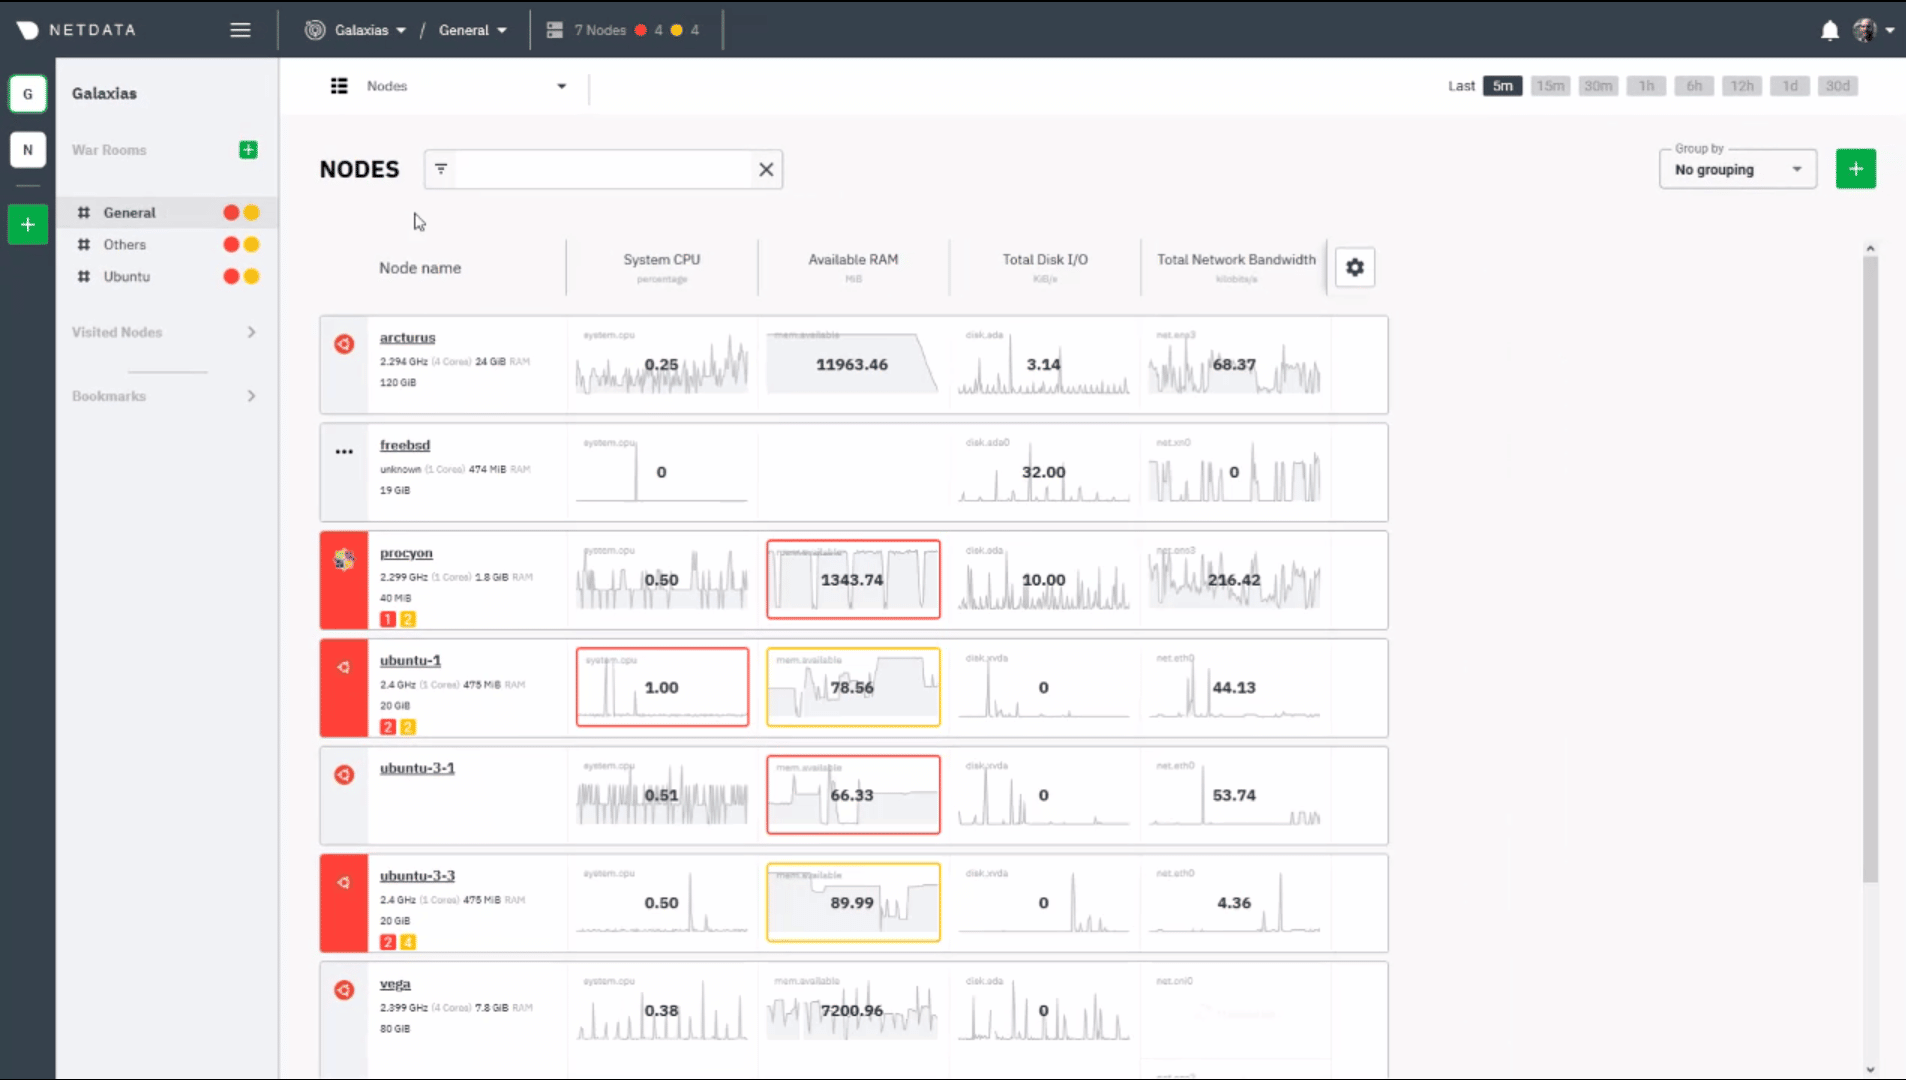
Here is my overview dashboard in Netdata. It shows all the node resources such as CPU, memory, load, etc.
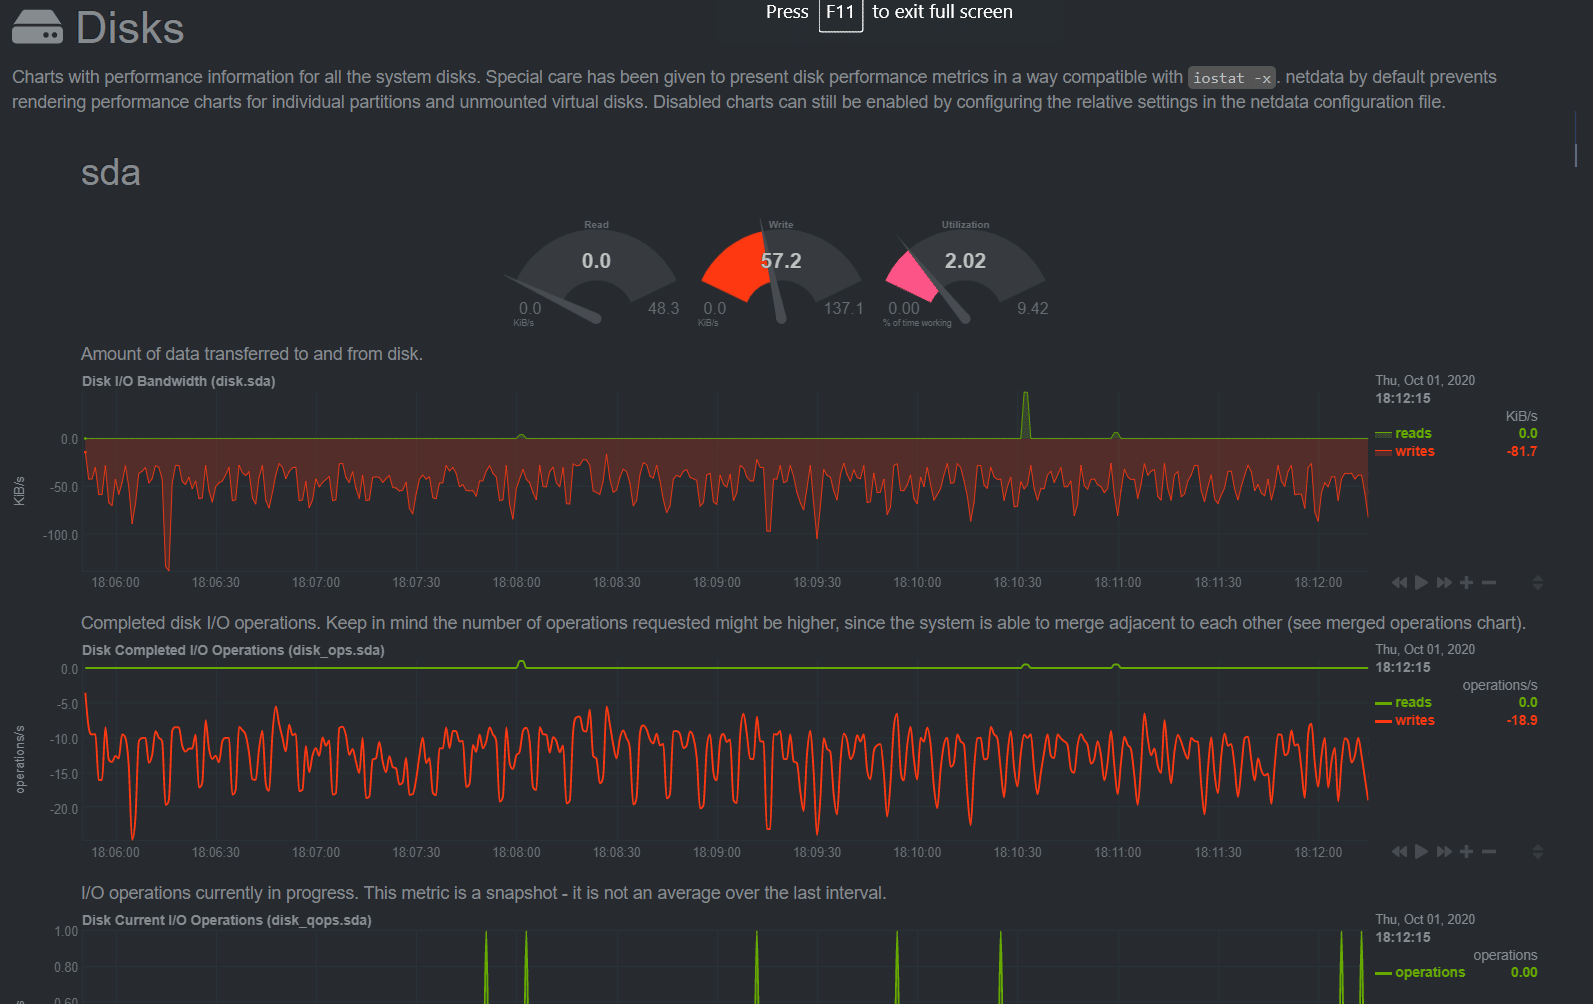
If I scroll down I get information about my hard drives
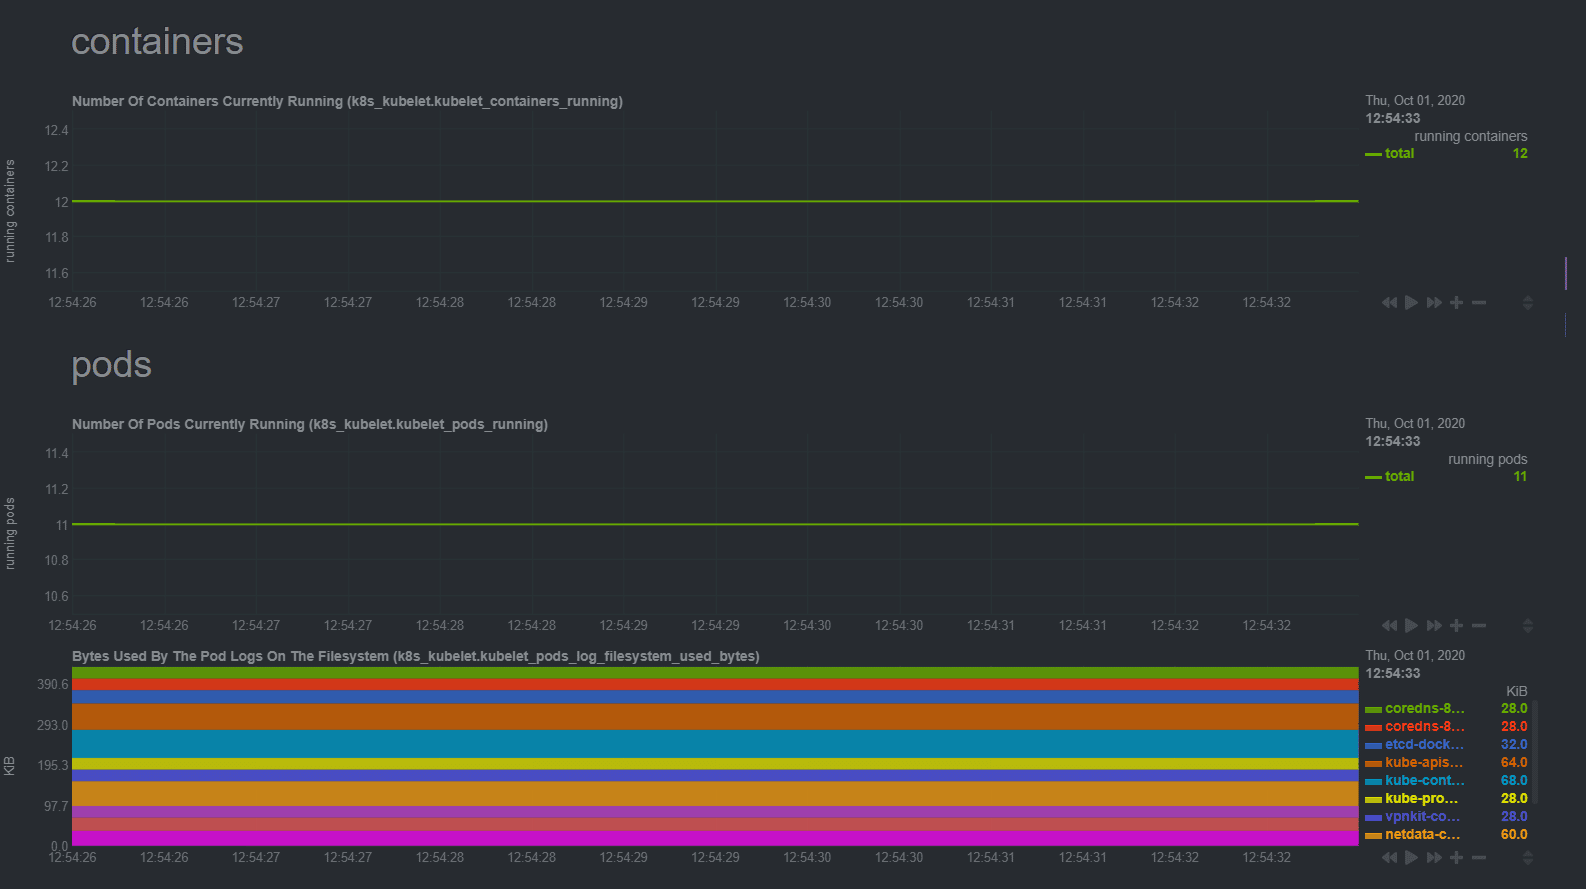
Now I want to go a bit deeper and see how many containers and pods I have:
And finally, I want to see specific information about my MySQL container:
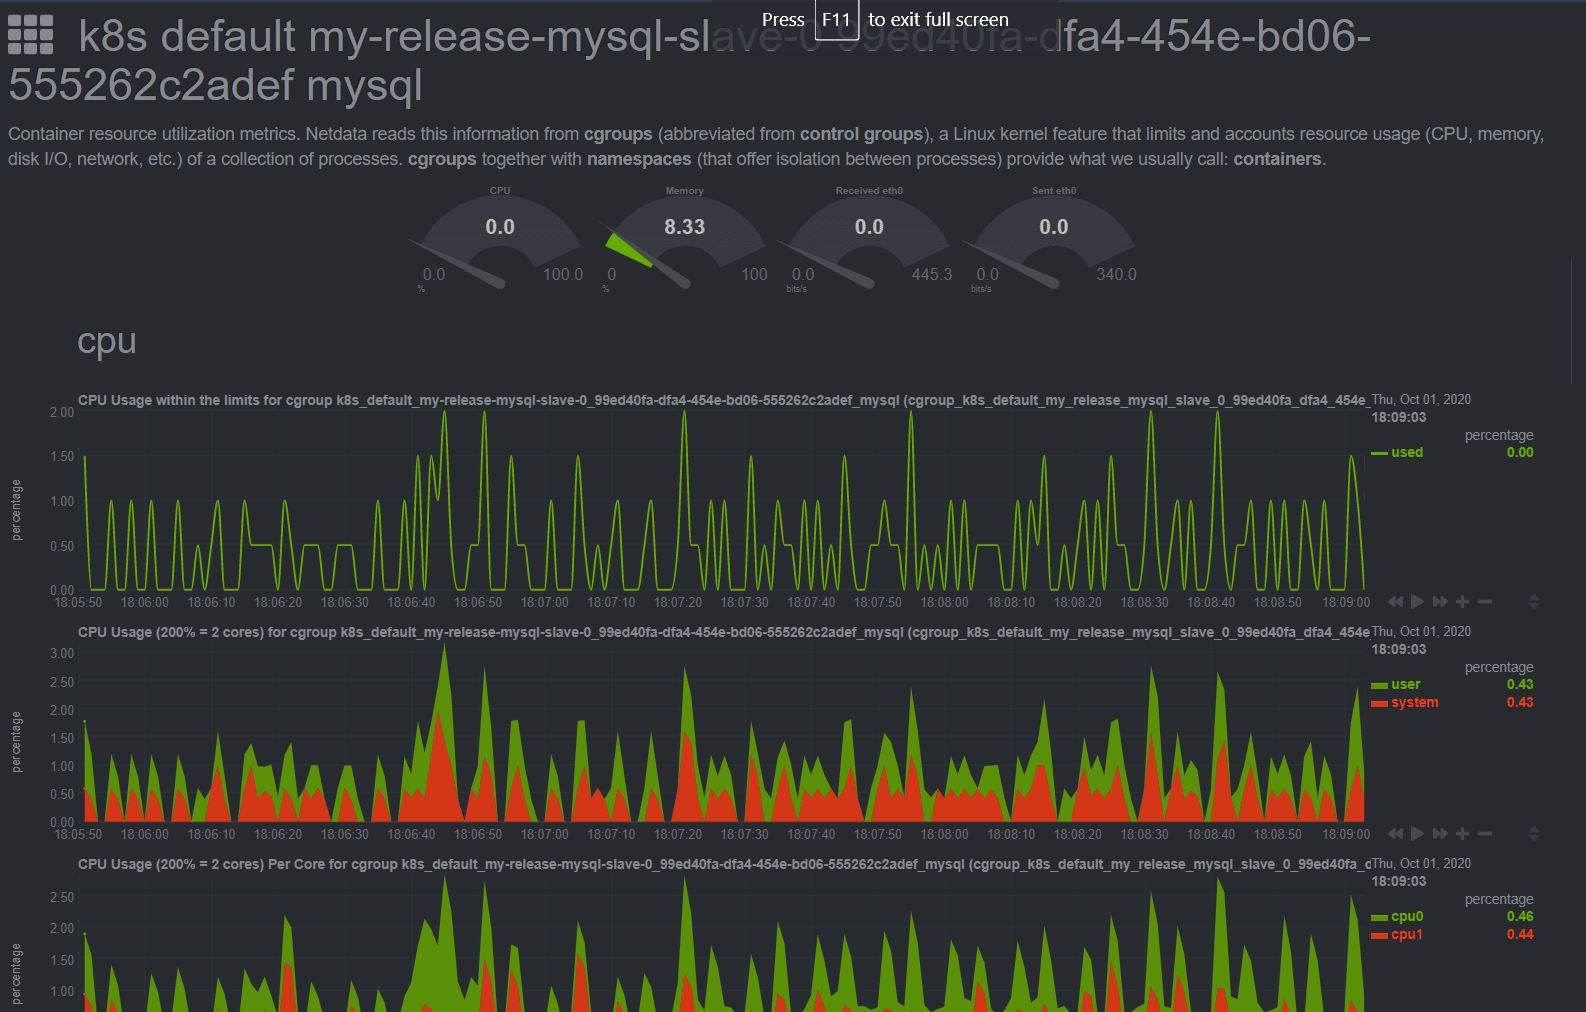
This is just a quick example, but the key point is that I got all these dashboards without any additional effort. I simply installed Netdata in my cluster like any other Helm package.
git clone https://github.com/netdata/helmchart.git netdata-helmchart
helm install netdata ./netdata-helmchart
That’s it!
I didn’t have to edit any configuration files or write a YAML script or do anything else. It doesn’t get any simpler than this. You can also see an online live demo installation to get an idea for the speed and responsiveness of the GUI.
Get access to 300+ monitoring integrations
The magic behind Netdata is that it comes with more than 300+ connectors for popular applications and infrastructure components.
This means that unless you have an exotic component in your platform, chances are that Netdata already supports your monitoring target and already has an existing dashboard that you can use immediately after installation.
As an example, here I am launching Netdata on a host that also has a Redis instance running.
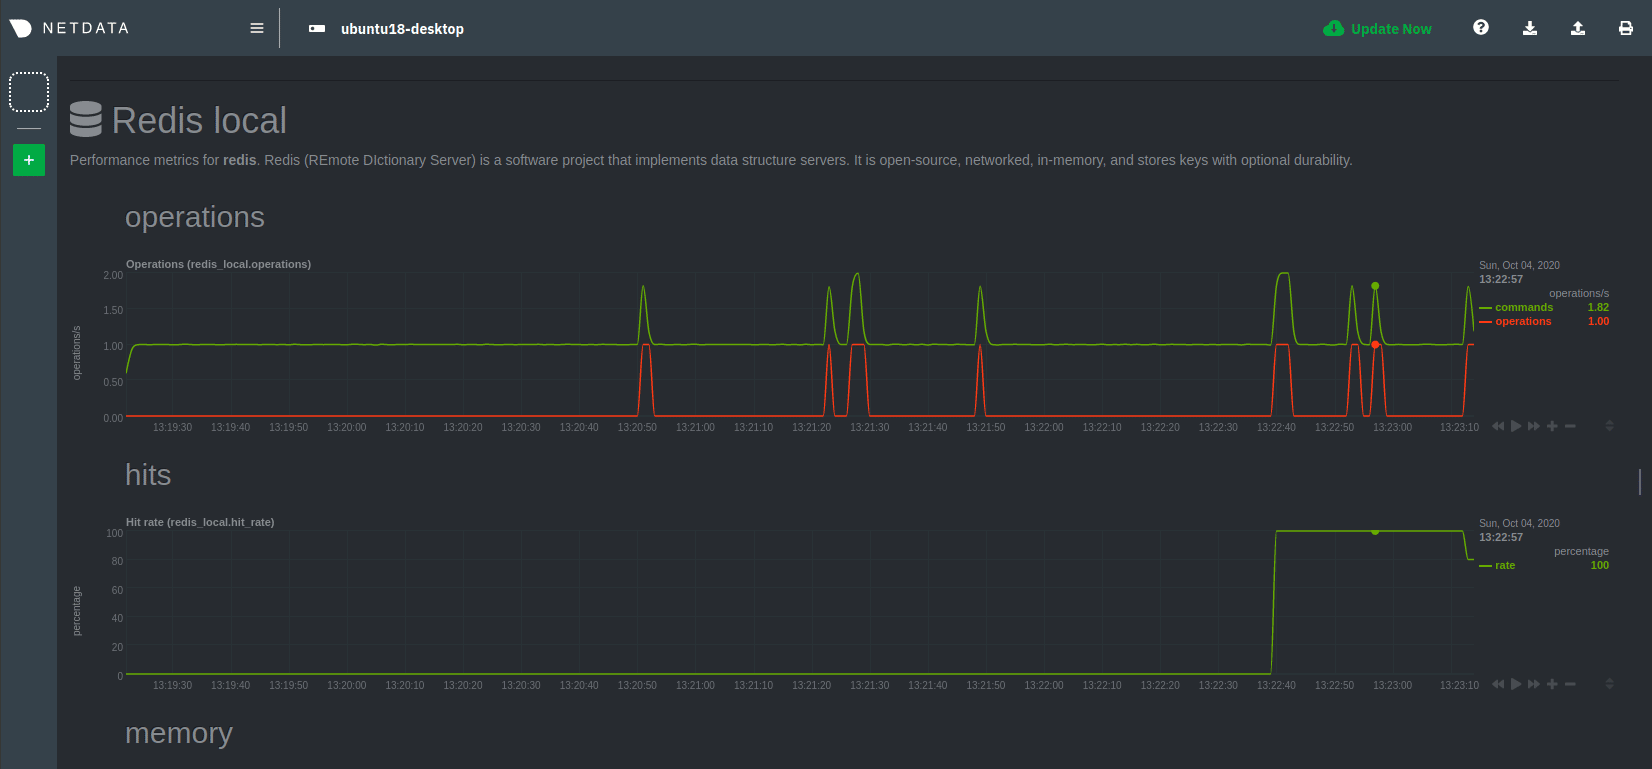
Netdata has automatically detected the Redis service and has created a brand new dashboard for Redis statistics.
The integrations offered by Netdata support several popular services such as databases (e.g. Postgresql, Mysql, Redis), containers (e.g. Docker, lxc, Docker engine), queues (e.g. RabbitMQ, ActiveMQ), networking (e.g. DNS, OpenLDAP, SNMP, Apache, Nginx) and even hardware sensors (.e.g RAID, SMART, GPUs).
Integration with Prometheus
It should be clear that getting system and container metrics from Netdata is a straightforward experience. But what about application-level metrics?
Even though Netdata has limited support for getting metrics from Spring or Go applications, the highlight of application monitoring is the native integration for Prometheus metrics.
In fact, Netdata supports two-way communication integration with Prometheus.
- You can send metrics from Netdata to Prometheus
- You can use Prometheus as a Netdata backend
This means that Netdata is not a Prometheus replacement but instead a complementary service that can be used for low-level system metrics in addition to Prometheus. Depending on your use case you have a lot of flexibility on how the two systems interact. You could
- Keep both platforms separate and use Netdata for system metrics and Prometheus for application metrics
- Feed system metrics from Netdata to Prometheus and only use your Prometheus dashboards
- Feed application metrics from Prometheus to Netdata and use only your Netdata dashboards
It is also worth mentioning that specifically for Kubernetes, Netdata can discover the services running inside the cluster and monitor them as well.
Netdata Cloud and other features
Netdata is a very flexible monitoring tool. Apart from Kubernetes, you can also use it to monitor Virtual machines, Apache web servers, Hadoop clusters, synology/freeNAS stations, and even air-gapped systems.
Instead of having multiple dashboard URLs for each platform, you can consolidate all your dashboards under one umbrella using Netdata cloud.
Netdata Cloud is a free online service that can be connected with all your Netdata installations, bringing all information under a single dashboard/URL. This means that you can have a uniform user interface from multiple (even unrelated) Netdata installations which is a great advantage for big organizations with several computing resources.
Netdata has also several other features that we didn’t cover in this article like built-in alerting and also the automatic correlation of metrics after an incident.
To get started with Netdata see the official documentation or jump straight into the Kubernetes or Docker installation instructions.