What Are DevOps Tools?
DevOps is a broad term encompassing the various platforms, applications, and tools that support a modern software development approach emphasizing cross-team collaboration and fast release cycles. The DevOps approach merges the traditionally separate development (Dev) and operations (Ops) components of the software development lifecycle into a single, seamless workflow.
DevOps tools are any tools that support DevOps methodologies. They encompass the whole SDLC, performing functions like version control, code reviews, monitoring, and deployment. The primary objectives of a DevOps pipeline include accelerating software release processes, automating all automatable tasks, improving scalability, and increasing the overall development speed.
A DevOps stack must include a monitoring tool that provides full visibility over production code quality. However, this critical component is just one of the many tools required in a typical DevOps project. The exact selection of DevOps tools depends on the specific business objectives and requirements. DevOps tools must be able to communicate and integrate, usually via extensions and APIs.
This is part of an extensive series of guides about software development.
What Is a DevOps Toolchain?
The DevOps toolchain contains tools and technologies that enable development and operations teams to collaborate throughout the software lifecycle. A complete toolchain covers DevOps concerns such as continuous integration, continuous delivery, automation, and collaboration.
DevOps is a cultural shift that unites development and operations teams. As part of this cultural change, there is a need to agree on a common set of tools. There is no single tool that supports all DevOps principles and practices. Instead, a DevOps toolchain is a collection of tools from different vendors that act as an integrated unit for designing, building, testing, managing, measuring, and operating software and systems.
Learn more in our detailed guide to DevOps tool chain (coming soon)
CI Tools
Continuous Integration (CI) is a methodology where developers frequently integrate code into a common repository. This process requires automation to enable efficiency. Developers use CI tools to automate builds, tests, and reports, allowing them to review and integrate code frequently.
These tools often integrate with other DevOps tools like security and testing solutions. They can automatically check software builds against the set criteria. CI tools are key to developing code and providing feedback quickly. By verifying code changes early and highlighting issues, CI helps ensure later success.
Here are some popular CI tools.
Jenkins
License: MIT License
Repository: https://github.com/jenkinsci/jenkins
This open source automation server provides plugins for building, deploying, and delivering software. It can distribute tasks across multiple machines and facilitates CI implementation with Jenkins Pipeline plugins. Jenkins is mature, battle tested, and offers a large ecosystem of plugins for many use cases. A remote access API allows developers to use various formats to facilitate collaboration.
Learn more in our detailed guide to Jenkins
CircleCI
License: Commercial
Repository: https://github.com/circleci
This cloud enterprise solution offers high performance, speed, and scalability, integrating with BitBucket and GitHub. It lets developers test every code commit and build large pipeline workflows. CircleCI can scale throughput by running parallel VMs. It has a GUI and YAML configuration.
Bamboo

License: Commercial
Product info: https://www.atlassian.com/software/bamboo
This CI automation server lets developers automatically build, test, and integrate application code. It supports many third-party tools via an intuitive GUI. Bamboo ensures code quality by handling integration and providing full visibility and support.
Buildkite
License: Commercial
Repository: https://github.com/buildkite
This CI pipeline testing platform helps prepare secure applications for delivery. It lets users build REST APIs and webhooks for custom tools and workflows and has broad language support (Python, Java, Node, Ruby, Haskell, etc.). Admins can configure access permissions for CI pipelines, while developers can easily build and test containerized applications with custom tools.
GitHub Actions
License: Commercial
Product info: https://docs.github.com/en/actions
This CI automation solution helps build, test, and deploy code using GitHub, with events like “push” directing automation. Developers can run multiple tests simultaneously across different operating systems. GitHub Actions provides IaC secrets storage and access to runtime environments and supports the major programming languages. It is GitHub-only.
Learn more in our detailed guide to GitHub Actions
CD Tools
Continuous Delivery (CD) extends CI’s automation to preparing software for deployment to production. CD and CI/CD tools are a staple of modern software development, providing developers with build artifacts ready for release. CD tools can build standardized, fully automated deployment pipelines.
Continuous Deployment is a related concept that extends automation to the code deployment process. It lets developers deploy new features often and with minimal downtime, providing a competitive business advantage.
Here are some examples of continuous delivery and continuous deployment tools.
Codefresh
License: Commercial, based on the open source Argo project
Codefresh is a modern continuous integration and continuous delivery toolchain built on the foundation of GitOps and Argo. It takes the best of the open source Argo toolset and provides essential enterprise features like a unified user interface, a single pane for cloud-wide management, secure enterprise-grade runtime, end-to-end auditability, and cross-application single sign-on.
It has comprehensive GitOps continuous deployment designed for Kubernetes and modern applications. It is built for flexibility and scalability around Argo Workflows and Argo Events. Codefresh seamlessly combines the continuous integration side with a powerful GitOps software delivery solution powered by Argo. It includes support for advanced deployments like canary, blue-green, and experimental releases with the ability to easily track builds and releases across your organization.
It provides comprehensive dashboards that offer visibility from code to cloud while integrating with your favorite tools. A centralized dashboard gives insight into deployments at scale while providing the security and support enterprises need.
Argo CD

License: Apache License 2.0
Repository: https://github.com/argoproj/argo-cd
This solution uses open source Argo tools to simplify and automate the deployment of Kubernetes-based applications. It facilitates auditing and rollbacks supporting GitOps and CD. All the configuration logic resides in Git, allowing developers to reuse existing workflows to build and review code.
Capabilities of Argo CD include:
- Automatic deployment to target environments.
- Multi-cluster deployment management.
- Support for various config management tools.
- SSO support with OAuth2, OIDC, SAML 2.0, etc.
- Strong RBAC-based authorization.
- Rollbacks based on the commit history in Git.
- Resource health analysis.
- Automatic drift detection.
- Automatic syncing of applications to the target state.
- Complex rollouts.
- Audit trails.
Flux

License: Apache License 2.0
Repository: https://github.com/fluxcd/flux
This tool automatically keeps Kubernetes clusters in sync with Git configurations, using a cluster operator to trigger Kubernetes deployments. Flux is a complete CD solution that monitors container image repositories and updates running configurations based on desired target states.
Key Flux features include :
- Various deployment methods—including canary and A/B.
- Infrastructure management—manages all resources in Kubernetes.
- Git integration—supports various providers like GitHub, GitLab, and Bitbucket.
- Multi-tenant model—supports multiple apps and repositories.
Flux can access Kubernetes without a separate CI tool. It maintains a Git audit log of all changes.
GitLab CI/CD
License: Open source, with commercial options for support and installation
Product info: https://docs.gitlab.com/ee/ci/
This CI/CD tool is part of GitLab, helping to manage Git-based application SDLCs. It includes a CI service to automatically build and test code and CD features to release them, supporting continuous deployment. GitLab CI/CD provides code branching, scanning, and testing tools, supporting the use of a Git repo as the single source of truth for GitOps projects. It is GitLab-only.
Harness

License: Commercial with community edition
Repository: https://github.com/harness
This CDaaS platform supports projects in the cloud and on-premises, allowing DevOps teams to automate tests, deployments, and rollbacks. It offers templates for several CD pipelines, including blue-green, canary, and rolling deployments.
Harness automatically detects code quality and performance issues, enabling automatic rollbacks and providing analytics and notifications. It also supports SSO and OAuth.
Spinnaker
License: Apache License 2.0
Repository: https://github.com/spinnaker/spinnaker
This CD platform manages multi-cloud code changes and builds testing and deployment pipelines—users can configure pipelines to launch other pipelines. Spinnaker enables container image building and deployment, rollouts, and rollbacks. It integrates with Prometheus, Stackdriver, and other monitoring services.
Learn more in our detailed guide to CI/CD tools
Test Automation Tools
Automated tests minimize the manual burden during code testing. Test automation tools allow DevOps teams to build automated test suites to check their applications. With test automation, teams can identify bugs across many artifacts—it is easy to integrate multiple tests into the CI/CD pipeline to provide fast feedback.
Automated tests reduce the bugs reaching production and the associated remediation costs. Here are some of the main test automation frameworks.
Mocha

License: MIT License
Repository: https://github.com/mochajs/mocha
This open source framework can run testing scripts in Node.js. It allows users to design descriptive tests and reports and even perform tests whenever a local change occurs. Mocha can run all test types using “describe” functions—assertions determine if the code passes or fails. It provides the necessary structure for automated tests, from simple unit checks to full-stack tests.
Mocha executes tests with the describe function and sends the results to a test report or console. Mocha reports tests as failed when assertions fail or cause exceptions. A pass report means all assertions are valid. Mocha can identify when tests take too long.
Selenium

License: Apache License 2.0
Repository: https://github.com/SeleniumHQ/selenium
This web application testing tool allows users to build powerful regression tests. It can automate browsers, making it useful for web-based and other applications. Selenium supports multiple operating systems, browsers, and languages. It can create scalable, distributable scripts.
Cypress

License: MIT License
Repository: https://github.com/cypress-io/cypress
This front end JavaScript testing tool helps address the main pain issues with web applications. It is developer-friendly, using DOM manipulation to operate in-browser. Cypress has an interactive test runner to execute all commands.
Testers can perform end-to-end tests to enable test-driven development. Cypress aims to enable development processes and tests in parallel. It automatically waits for assertions and commands, takes snapshots during tests for observability, and enables server management via stubs, clocks, and spies.
Cucumber
License: MIT License
Repository: https://github.com/cucumber
This testing tool supports behavior-driven development, allowing users to write intuitive tests. Scenarios and tests specify the desired system behavior to inform how developers write code. Cucumber originally used Ruby but now supports multiple programming languages, including Gherkin—a non-technical, easy-to-read language for describing test cases.
The Gherkin syntax promotes behavior-driven development across the DevOps team. It helps enforce clear requirements for all stages of the SDLC.
Learn more in our detailed guide to DevOps tools for testing (coming soon)
DevOps Security Tools
Historically, DevOps teams worked separately from security teams, leaving crucial security practices to the end of the SDLC. A modern approach introduces security into DevOps to enable DevSecOps. This approach shifts security left, addressing security from the start of the SDLC.
DevOps security tools incorporate security tasks into the CI/CD pipeline, enabling the automated inspection and analysis of code throughout the build, test, and deployment stages. DevSecOps improves security while accelerating development and facilitating regulatory compliance.
Here are some examples of DevOps security tools.
OWASP Zed Attack Proxy (ZAP)

License: Apache License
Repository: https://github.com/zaproxy/zaproxy
This web application scanner is an open source OWASP project for identifying vulnerabilities in web and mobile applications. ZAP detects security weaknesses by sending malicious messages to test an application. A global open source community maintains this tool, which supports multiple programming languages and facilitates manual tests.
Codacy

License: Commercial
Repository: https://github.com/codacy
This code review tool detects patterns indicating code quality and security issues. An interface provides details about code to inspect its quality. Codacy can integrate with GitHub to identify code errors and accelerate the code review process. It helps monitor code quality over time and can automate static code tests.
SonarQube

License: GNU v3
Repository: https://github.com/SonarSource/sonarqube
This code review tool automatically detects code bugs and vulnerabilities. It integrates with existing workflows for continuous code examination. The development process usually involves developers merging code to a DevOps platform, which the CI tool inspects, builds, and tests. A SonarQube scanner then analyzes the test results and provides feedback via an interface or notifications.
Veracode
License: Commercial
Repository: https://github.com/veracode
This static analysis tool checks libraries across the major languages and frameworks without accessing the source code. It can analyze external and proprietary components and integrate with CI/CD tools via an API. Veracode offers a pipeline scanning feature to check new commits for flaws and compare and prioritize security issues.
Production Monitoring Tools
Monitoring tools allow DevOps teams to react quickly to application performance changes. Developers can shift left to minimize the breaking changes in production. By detecting issues early, teams can deal with them automatically or manually.
DevOps monitoring tools typically perform one or more of these functions:
- Infrastructure monitoring—checks server performance by identifying RAM, CPU, and storage statistics.
- Network monitoring—checks inbound and outbound data to provide visibility into all network requests.
- Performance monitoring—measures application performance by querying the server and tracking response times and other metrics.
Here are some examples of DevOps monitoring tools.
Prometheus

License: Apache License
Repository: https://github.com/prometheus/prometheus
This open source toolkit monitors and provides alerts for containers and microservices. It notifies DevOps teams of issues with APIs and connected services or applications, identifying traffic anomalies that may indicate a security threat. Prometheus supports various graphing and dashboard modes, with metrics to help track business statistics. It can detect targets using service discovery and static configuration.
New Relic
License: Commercial
Repository: https://github.com/newrelic
This performance analytics and management tool provides in-depth visibility, allowing users to build consistent software directly from the source code. New Relic offers:
- Telemetry data—collect and investigate metrics, logs, and events from all sources, helping investigate unknown issues.
- Full-stack visibility—visualize and analyze the whole software stack with a single tool.
- AIOps—identify, investigate, and address incidents quickly using applied intelligence and machine learning.
Nagios Core
License: GNU General Public
Repository: https://github.com/NagiosEnterprises/nagioscore
This open source infrastructure monitoring tool helps organizations track business-critical components like operating systems and network protocols. It generates alerts for component failures and recoveries, providing various monitoring and infrastructure management features.
The Nagios Core API can integrate with third-party platforms, allowing teams to transfer data across different systems.
Splunk
License: Commercial with open source version
Repository: https://github.com/splunk
This continuous monitoring tool lets organizations monitor the whole application lifecycle, providing real-time monitoring and analysis for cloud and on-premise infrastructure. It offers real-time alerting, scaling, and full-stack visibility in one solution. The Splunk community has thousands of active users and hundreds of integrations.

TIPS FROM THE EXPERT
In my experience, here are tips that can help you better adapt to using DevOps tools effectively:
- Use version control for everything: Manage not only your code but also configuration files, infrastructure definitions, and documentation in version control systems like Git. This ensures traceability and facilitates collaboration.
- Leverage containerization: Utilize Docker and Kubernetes to standardize environments and ensure that applications run consistently across different stages of the pipeline. Containers help in achieving scalability and efficient resource utilization.
- Adopt a microservices architecture: Break down your applications into microservices to improve modularity and allow for independent development, testing, and deployment. This approach simplifies troubleshooting and enhances scalability.
- Automate infrastructure management: Use Infrastructure as Code (IaC) tools like Terraform or Ansible to automate the provisioning and management of your infrastructure. This ensures consistency, repeatability, and easy rollback capabilities.
- Implement continuous feedback loops: Use tools that provide continuous feedback, such as static code analyzers and automated test suites. Continuous feedback helps in identifying issues early and improving the overall quality of the software.
CI/CD Simplified with Codefresh
Codefresh is unique among other solutions surveyed in this article, due to its ability to deploy seamlessly into a Kubernetes cluster and save the entire configuration to Git.
Enterprise version of the Argo stack
The Codefresh runtime includes the enterprise version of the entire Argo stack – with tools to simplify their operation and provide better traceability between them. By building on and integrating Argo Workflows and Events for running delivery pipelines, as well as Argo CD and Rollouts for GitOps deployments and progressive delivery, Codefresh provides a stronger security model, with a greatly simplified management that works at scale.
Simplified CI/CD pipelines
Codefresh Delivery Pipelines greatly simplify the creation and monitoring of workflows along with their triggers. These pipelines are optimized for CI/CD scenarios, making it possible to check out code, build and test artifacts using a GitOps work model.
Codefresh GitOps provides the application deployment layer. Defining an application is as simple as identifying a source repo and its target. Codefresh GitOps is built on Argo CD and Argo Rollouts to power progressive delivery.
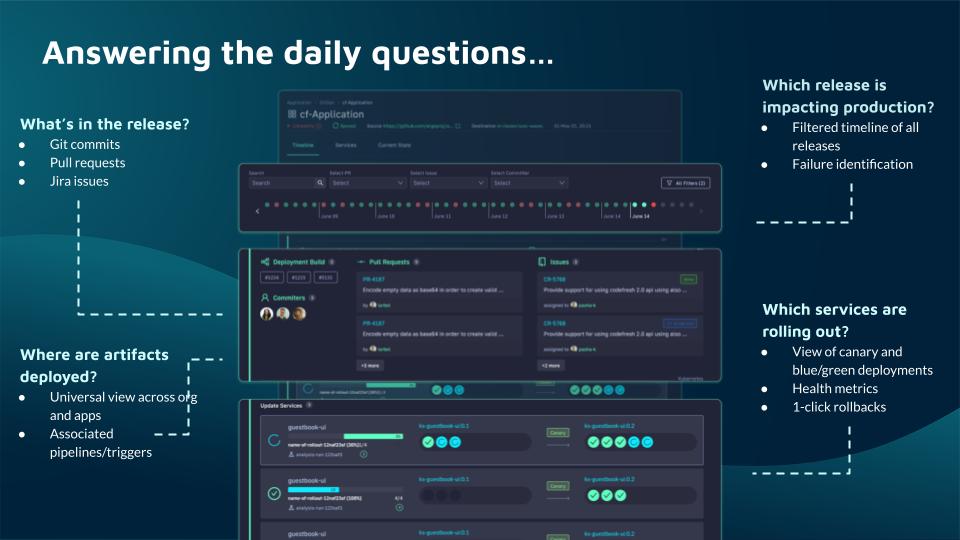
In addition, the platform seamlessly integrates with Git, JIRA, and many other popular development tools, providing a single dashboard of all activity in the software supply chain.
Bringing all these components into a single flow makes it easy to identify the cause of breaking changes, and keep track of all your running infrastructure and applications as changes flow into them. With easy remediation, teams have more confidence in deploying more frequently across the entire application portfolio.
Enterprise scale
Lastly, Codefresh works at scale. Filtering all changes by deployment time, committer, application, JIRA issue, or several other dimensions brings incredible traceability and clarity. The dashboard can even track all the locations a particular artifact is deployed across the entire organization.
See Additional Guides on Key Software Development Topics
Together with our content partners, we have authored in-depth guides on several other topics that can also be useful as you explore the world of software development.
The World’s Most Modern CI/CD Platform
A next generation CI/CD platform designed for cloud-native applications, offering dynamic builds, progressive delivery, and much more.
Check It Out
