One of the major objectives of the Codefresh platform is to give you full visibility from source code to production. Several Codefresh features (such as the integrated Docker registry or the Helm environment board) are designed specifically so that you can get the full picture of your CI/CD process from a single application.
It is therefore important to be able to see all the details of your pipelines and what they do at any given time. The new pipeline view is already great for visualizing the different steps on your pipeline and with the stage support it is very easy to organize visually even complex pipelines with many parallel steps.
To take this visibility one step further we have recently added two important features in the Codefresh platform:
- Build metrics for a pipeline both in the pipeline level and for an individual step.
- Comprehensive audit logs so that you have a full view on when & what was changed in your pipelines.
See what resources are consumed by your pipelines
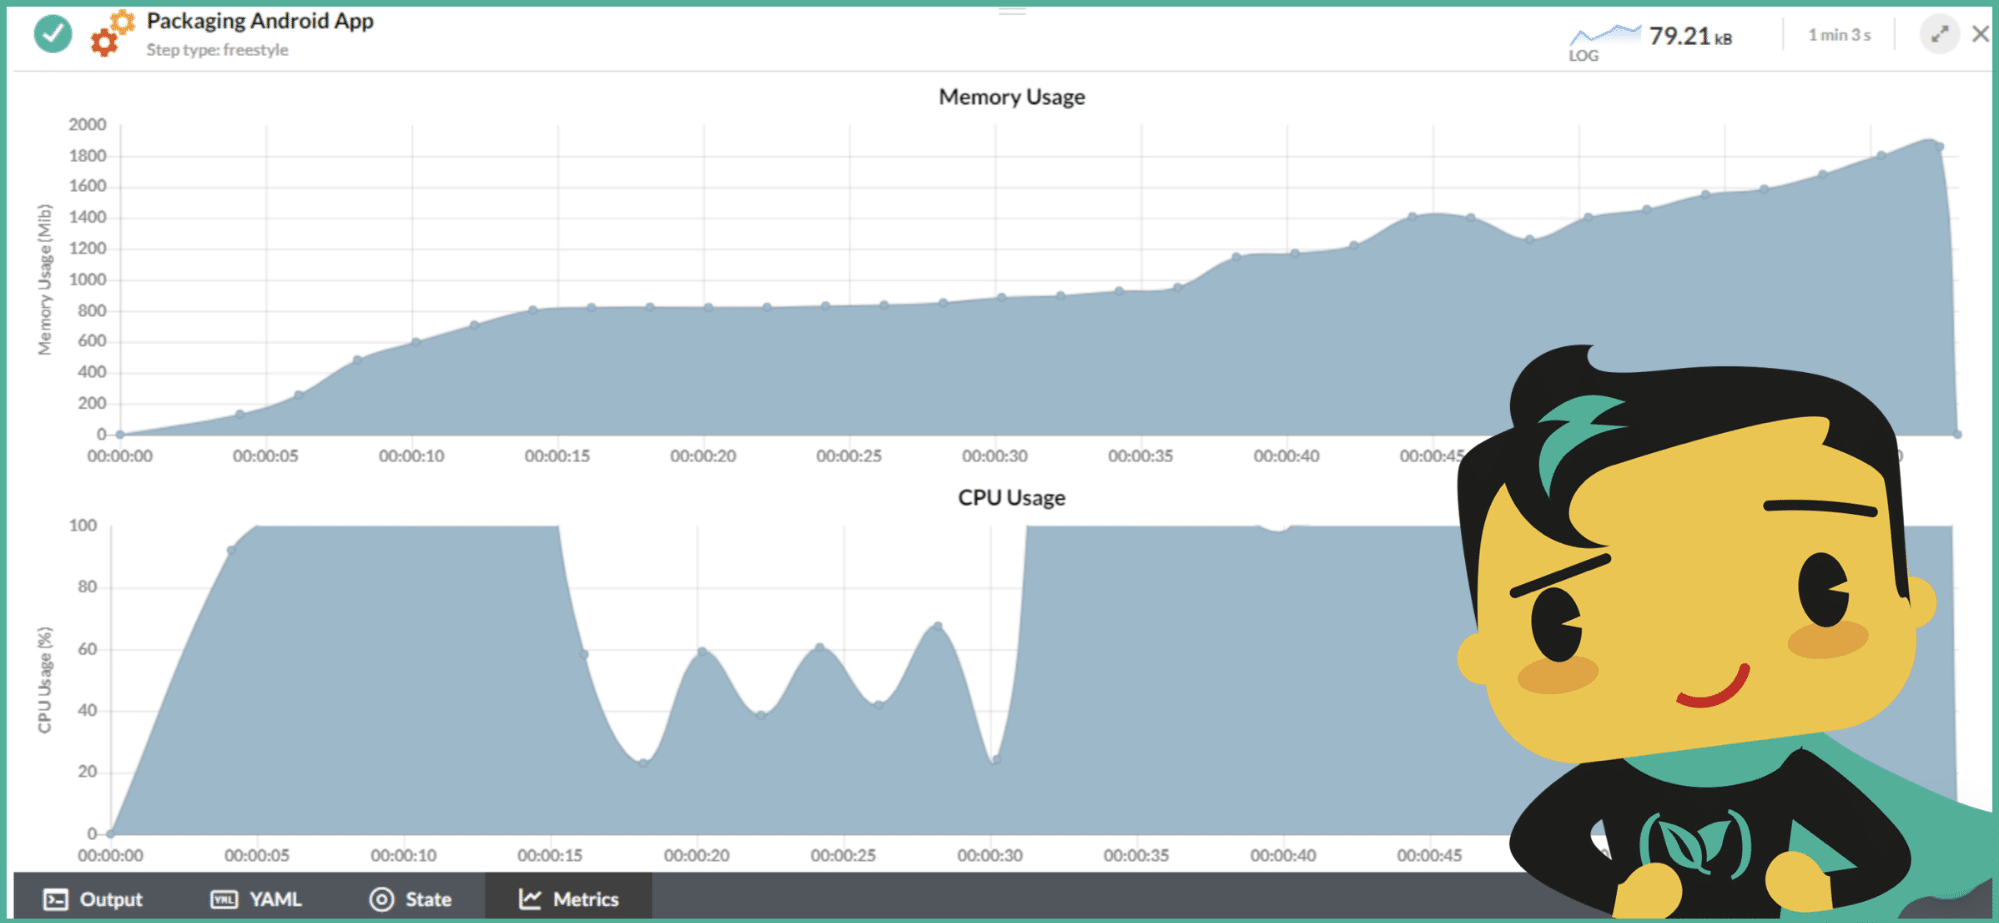
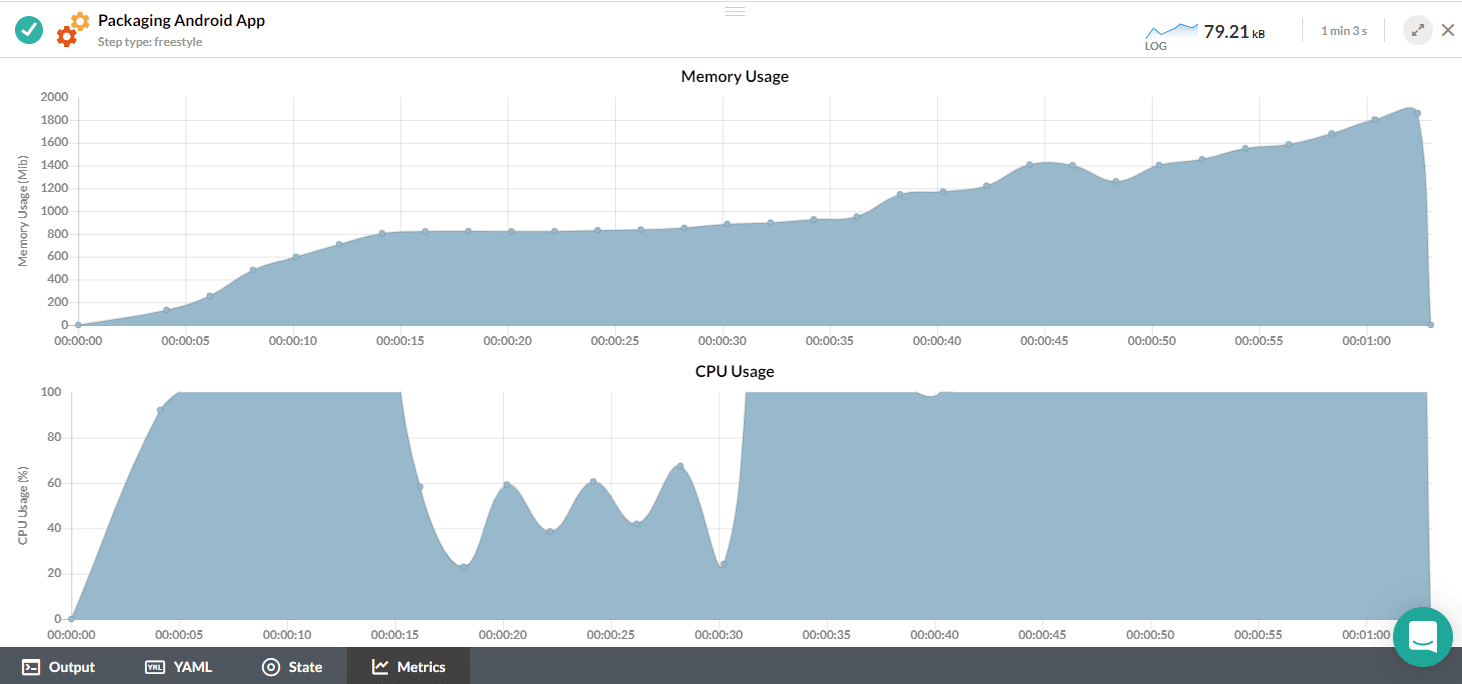
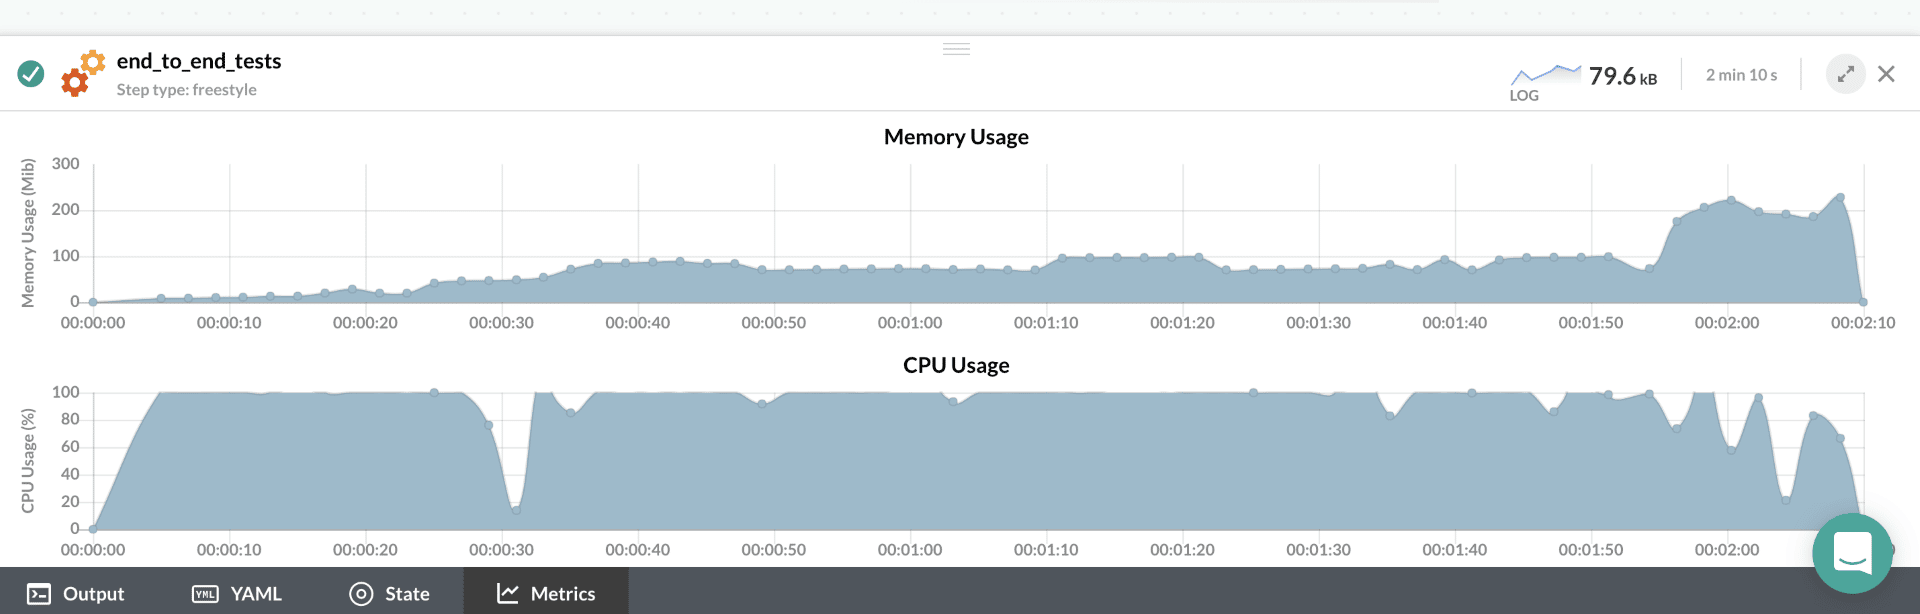
In the pipeline view, at the footer of the window, you will notice a new button called “metrics”. Click on it and you will get a graphical overview of all memory consumed by the whole pipeline.
The graph shows memory consumed over the time the pipeline was running and is very useful if you want to see which pipelines consume much more memory than expected. Codefresh will also present you a warning message when your build is close to the memory limit allowed by your plan.
For pipelines where memory is increased on a sudden rate, Codefresh will also mark the graph with individual steps and their memory consumption.
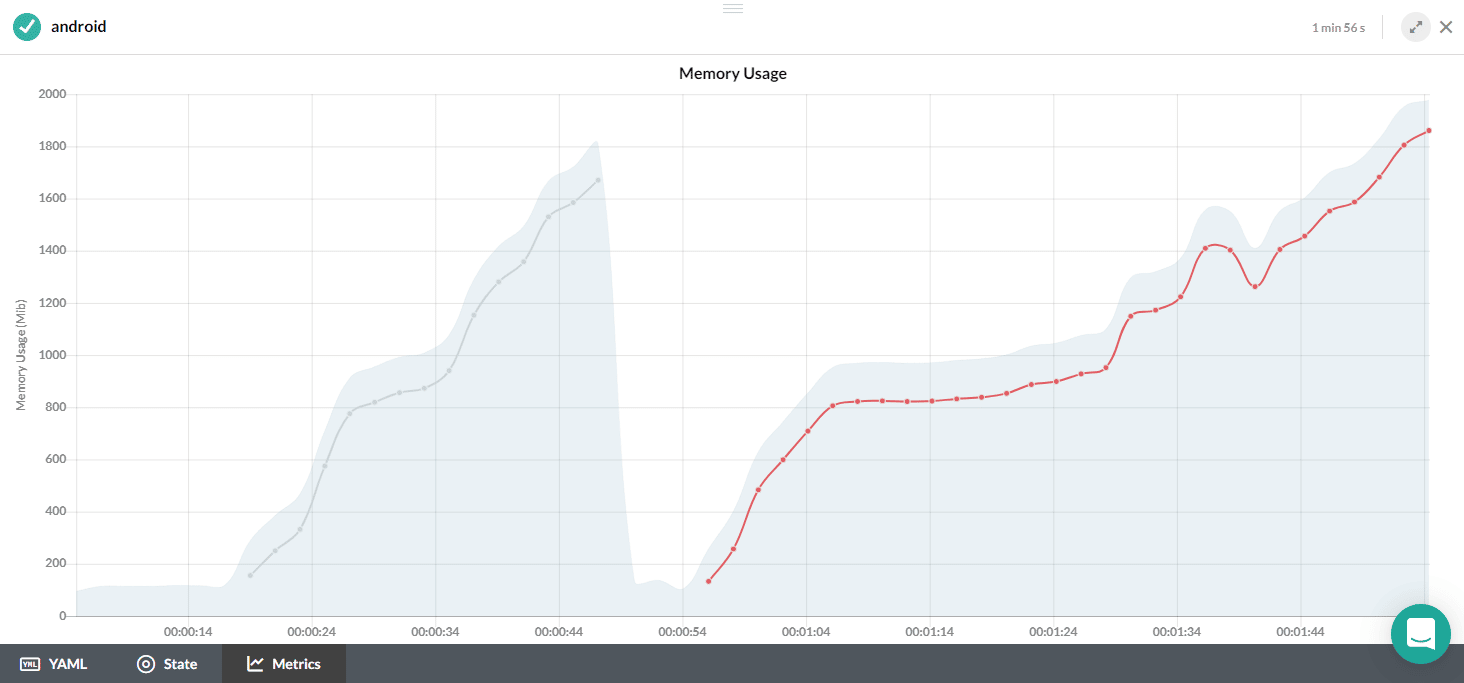
This is an example of an Android build. The first spike is when running unit tests and the second one is the phase where the application is packaged.
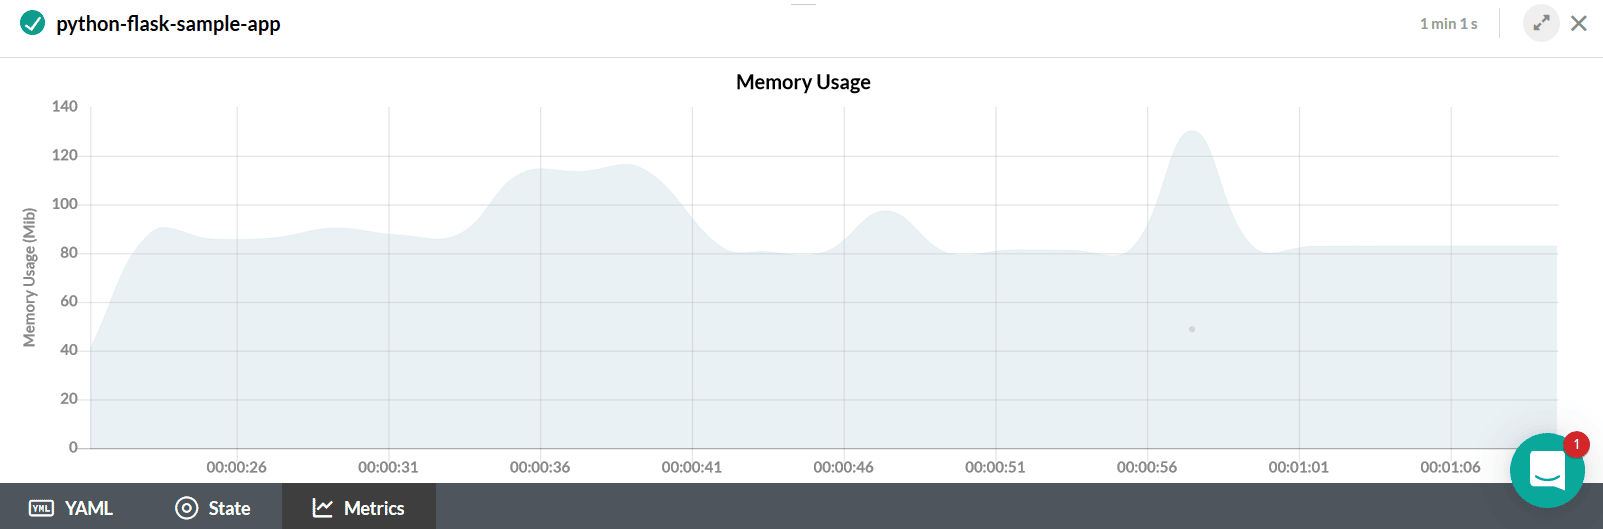
These graphs show what happened for the whole pipeline. You can drill further down into your metrics by clicking in a specific step within the pipeline. In that case, Codefresh will also show the CPU usage of that step.
This view is especially interesting in the case of unit or integration tests as it can help you down visualize resources that are consumed by each test.
Pipeline metrics are available today in all Codefresh pricing plans.
View Audit logs from all pipeline actions
Creating and changing pipelines in Codefresh is a process which can be easily monitored in a small team where all people follow best practices and official guidelines.
In bigger teams, however, it soon becomes very difficult to remember which member changed which pipeline. Especially in an Enterprise context, having a written record of all pipeline actions is an essential requirement for accountability and security purposes.
Codefresh has recently added a dedicated Audit screen that serves as the catalog of all pipeline events that happened in the platform organized by time.
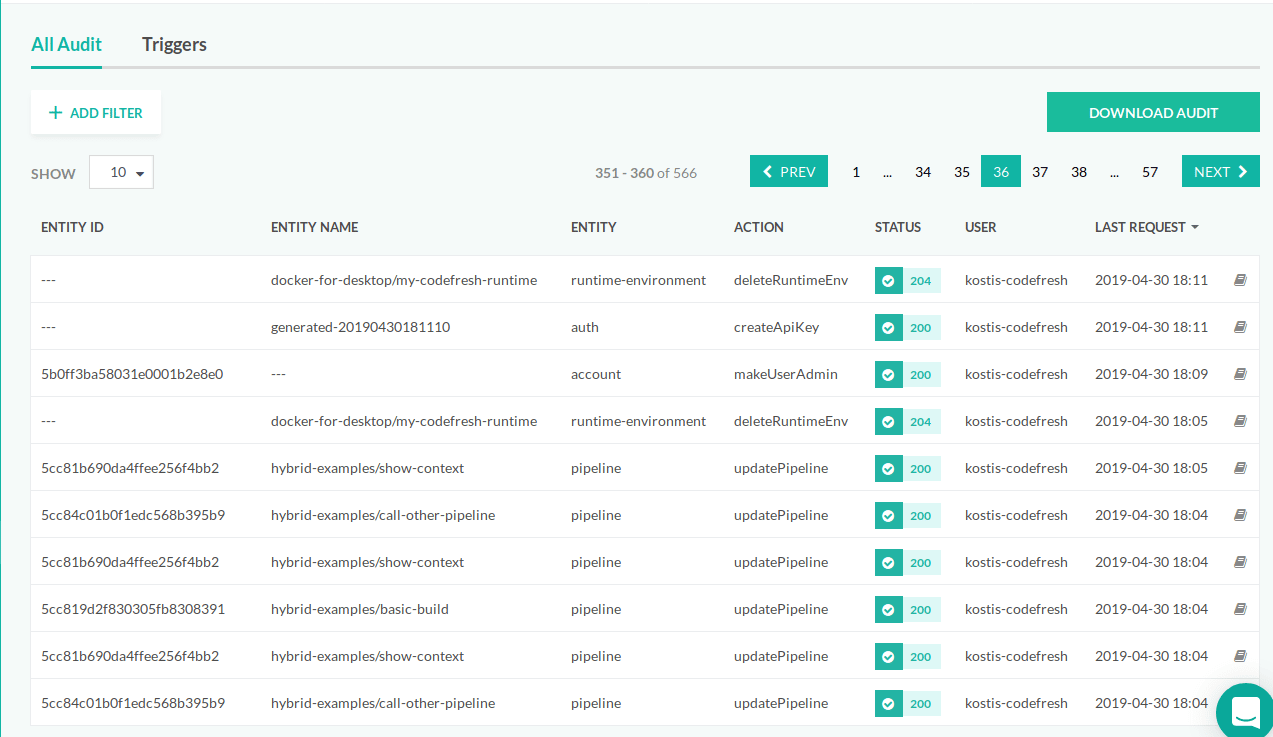
The audit log screen keeps a record of all pipeline and trigger actions that happen in Codefresh.
The audit events are fetched from the Codefresh API. This means that all events are recorded here even if they happened:
- From the Codefresh Web application (which itself uses the API)
- From the Codefresh CLI
- From any external tool that communicates with Codefresh
You can click on the payload icon on the right-hand side of each event row and look at the actual payload of that particular API call. You can also export pipeline events to a CSV file for further processing by your own tools.
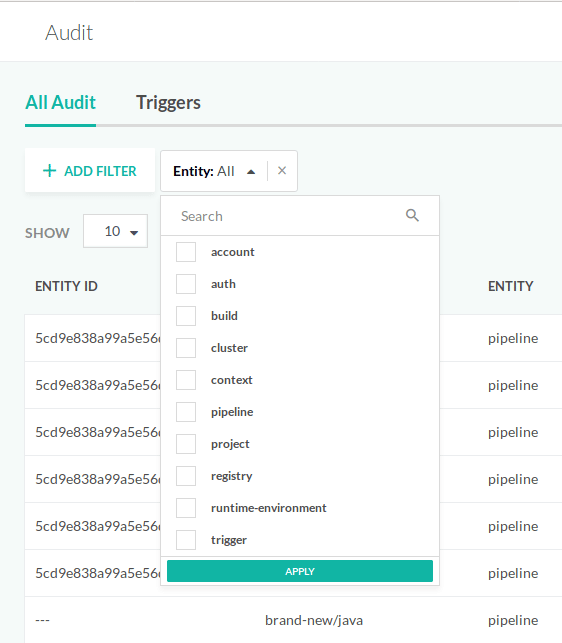
The Audit screens also comes with built-in filtering and paging allowing you to focus on an existing user/action/project etc.
The Audit screen is available to Codefresh Enterprise accounts.
Ready to try Codefresh and start creating your own CI/CD pipelines for microservices? Create Your Free Account Today!