This is the second part in our Kubernetes Anti-patterns series. See also part 1 for for the previous part and part 3 for the next part. You can also download all 3 parts in a PDF ebook.
Antipattern 6 – Using Kubectl as a debugging tool
While we are still on the topic of kubectl, is it important to mention its second-biggest shortcoming. Kubectl is not a debugging tool and should not be used as such.
Every company that started adopting Kubernetes has eventually run into a problem that prompted the “10-questions-game” with kubectl. If you have a critical problem in your production cluster your first impulse should not be opening a terminal with kubectl. If you are doing this you have already lost the battle, especially if it is 3am, production is down and you are on call.
kubectl get ns
kubectl get pods -n sales
kubectl describe pod prod-app-1233445 -n sales
kubectl get svc - n sales
kubectl describe...
All your Kubernetes clusters should have proper monitoring/tracing/logging systems in place that can be used for pinpointing issues in a timely manner. If you need to run kubectl to inspect something it means that you have a gap in your observability tools and the thing that you need to inspect should be added to your monitoring tools.
Even if you simply want to inspect a cluster that you are not familiar with you should use a dedicated tool for this purpose. There are many tools for inspecting Kubernetes clusters today.
Kubevious for example is a comprehensive Kubernetes dashboard with a built-in rule engine that allows you to search and mark Kubernetes resources according to custom rules.
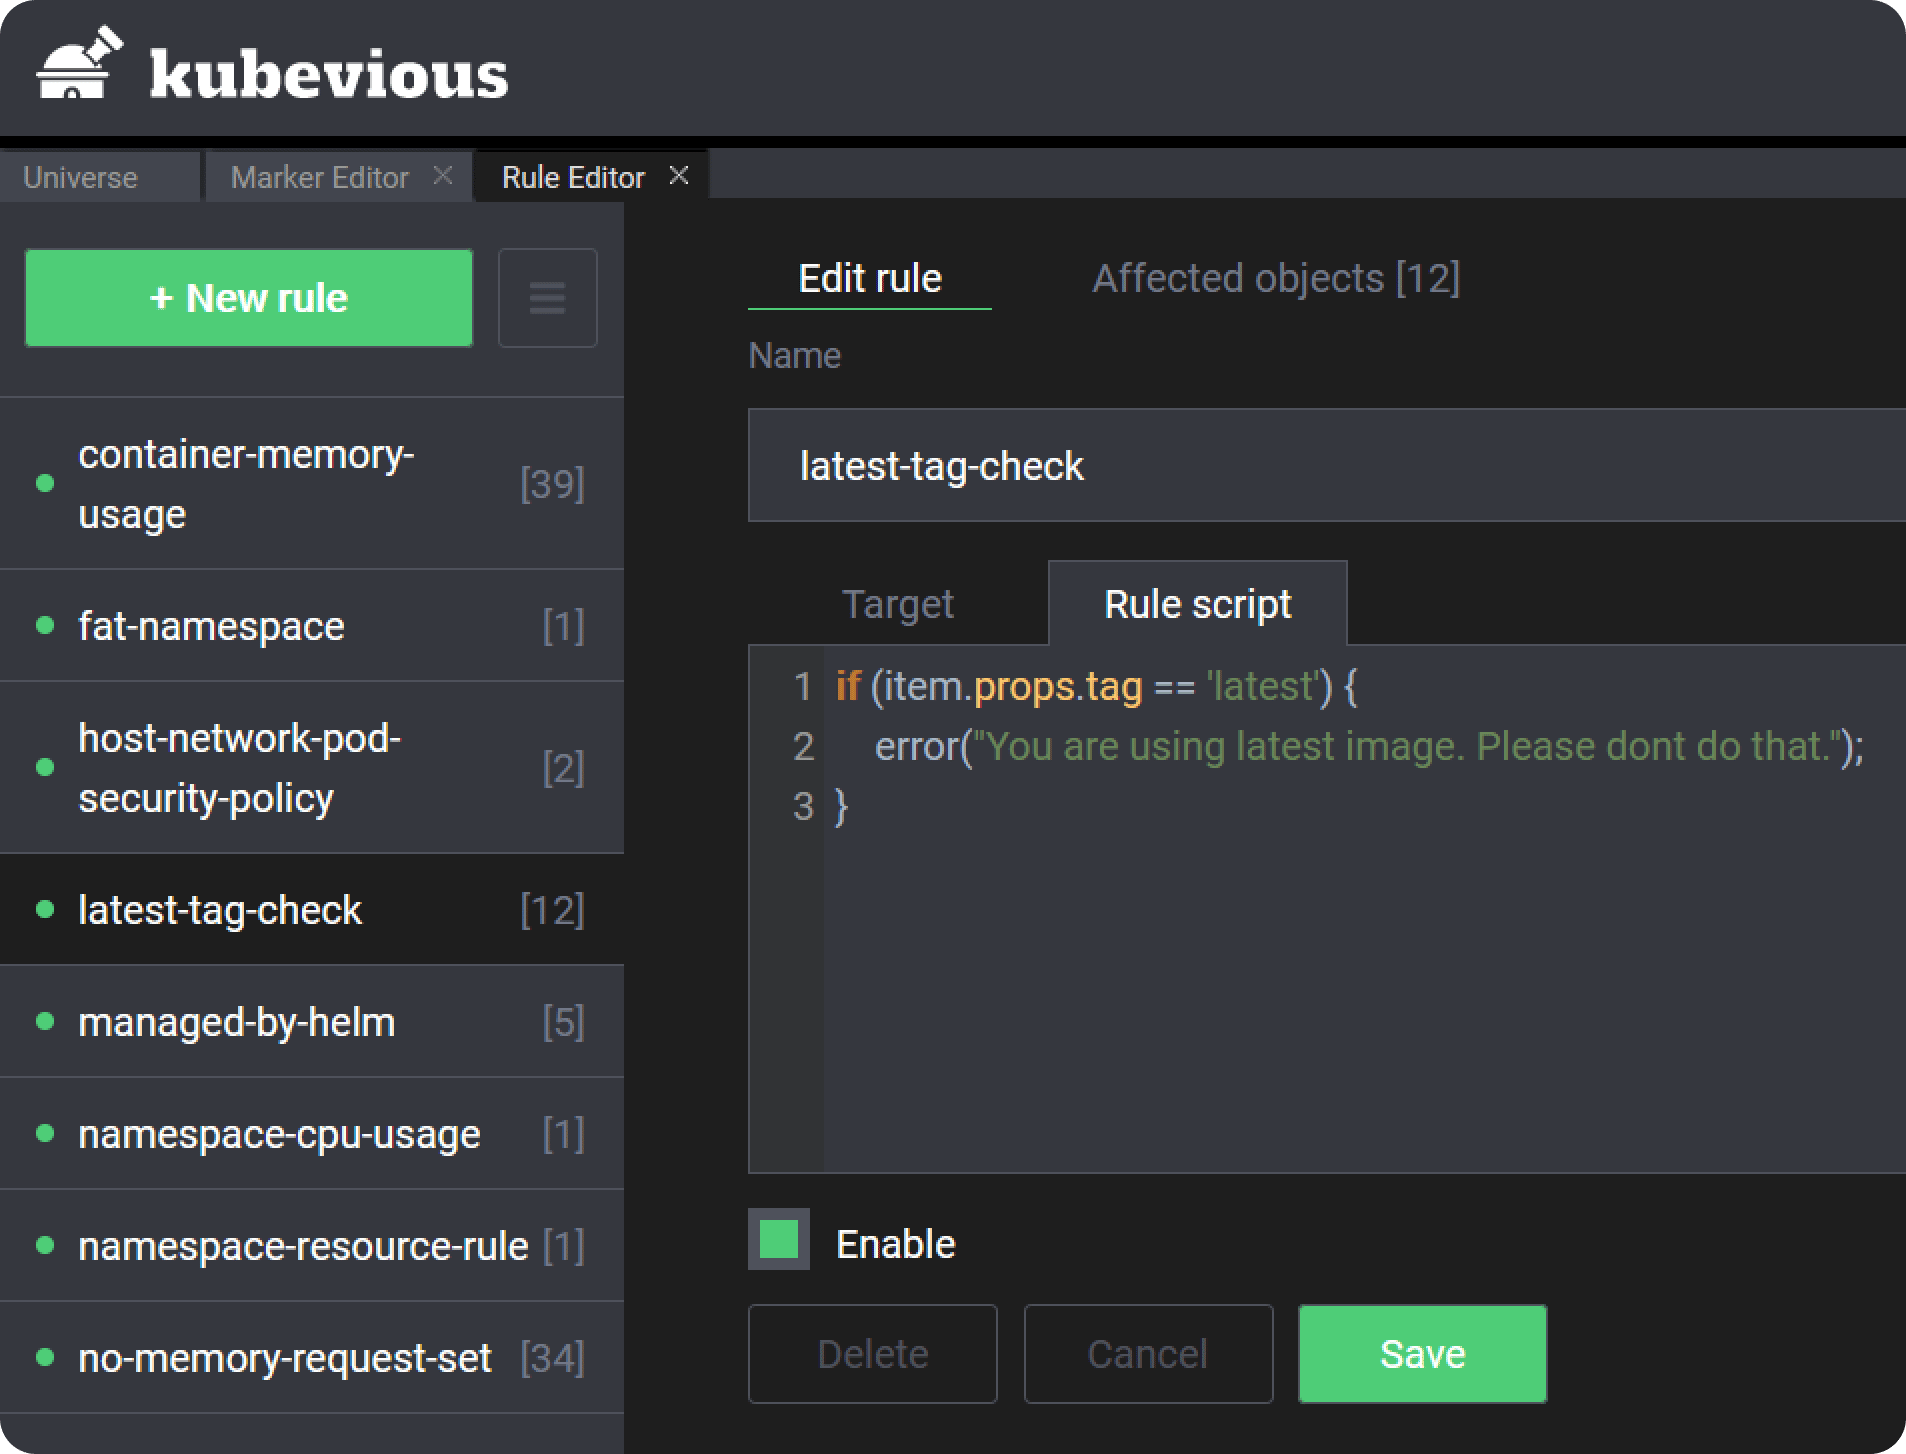
Metrics and tracing are so important that will be discussed in another anti-pattern later in our list.
Anti-pattern 7 – Misunderstanding Kubernetes network concepts
Gone are the days, where a single load balancer was everything you needed for your application. Kubernetes introduces its own networking model and it is your duty to learn and understand the major concepts. At the very least you should be familiar with load balancers, clusterIPs, nodeports and ingress (and how they differ).
We have seen both ends of the spectrum, where organizations create an overkill setup with a heavy-weight ingress controller (when a simple load balancer would suffice) or creating multiple load balancers (wasting money on the cloud provider) instead of a single ingress setup.
Understanding the different service options is one of the most confusing aspects for people starting with Kubernetes networking. ClusterIP services are internal to the cluster, NodePorts are both internal and external and Load balancers are external to the cluster, so make sure that you understand the implications of each service type.
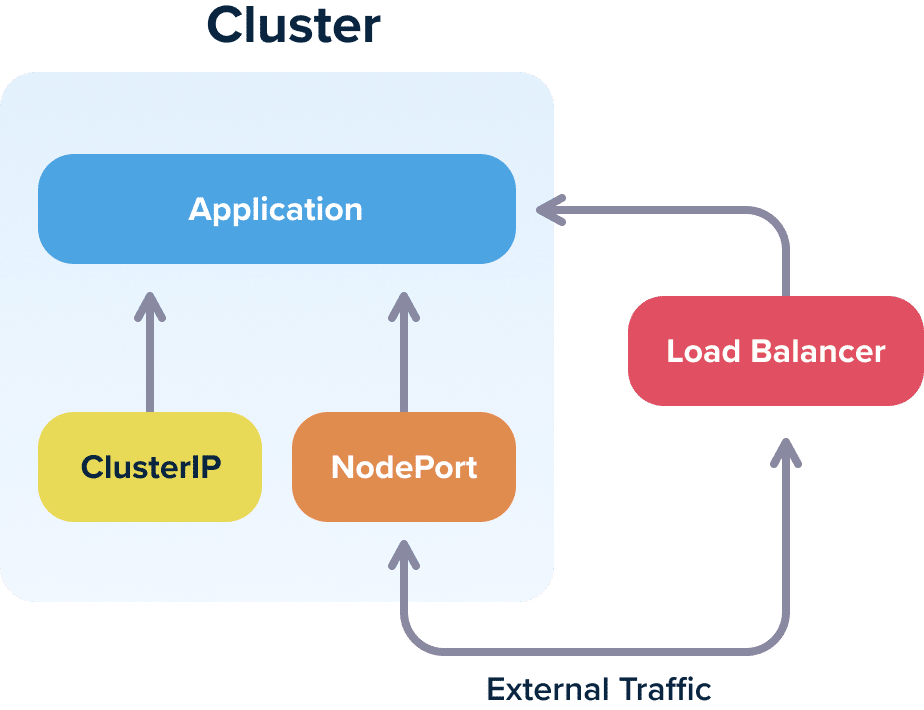
And this is only for getting traffic inside your cluster. You should also pay attention to how traffic works within the cluster itself. DNS, security certificates, virtual services are all aspects that should be handled in detail for a production Kubernetes cluster.
You should also spend some time to understand what a service mesh is and what problems it solves. We do not advocate that every cluster should have a service mesh. But you should understand how it works and why you would need it.
You might argue that a developer should not have to learn about these networking concepts just to deploy an application, and you would be correct. We need an abstraction on top of Kubernetes for developers, but we don’t have it yet.
Even as a developer you should know how traffic reaches your application. If a request needs to perform 5 hops between pods, nodes and services and each hop has a possible latency of 100ms, then your users face a possible delay of 500ms when visiting a web page. You should be aware of this, so that spending effort to optimize response time is focused on the true bottlenecks.
Also as a developer you should know what kubectl proxy does behind the scenes and when to use it.
Anti-pattern 8 – Using permanent staging environments instead of dynamic environments
With virtual machines (and even more so with bare metal servers) it is customary for a software team to have multiple predefined test environments that are used to verify an application before it reaches production.
One of the most common patterns is having at least 3 environments (QA/staging/production) and depending on the size of the company you might have more. The most important of these environments is the “integration” one (or whatever the company calls it) that gathers all features of developers after they are merged to the mainline branch.
Leaving aside the aspects of cost (if you have predefined test environments you always pay for them in terms of computing capacity even when they are not used) the most pressing issue is feature isolation.
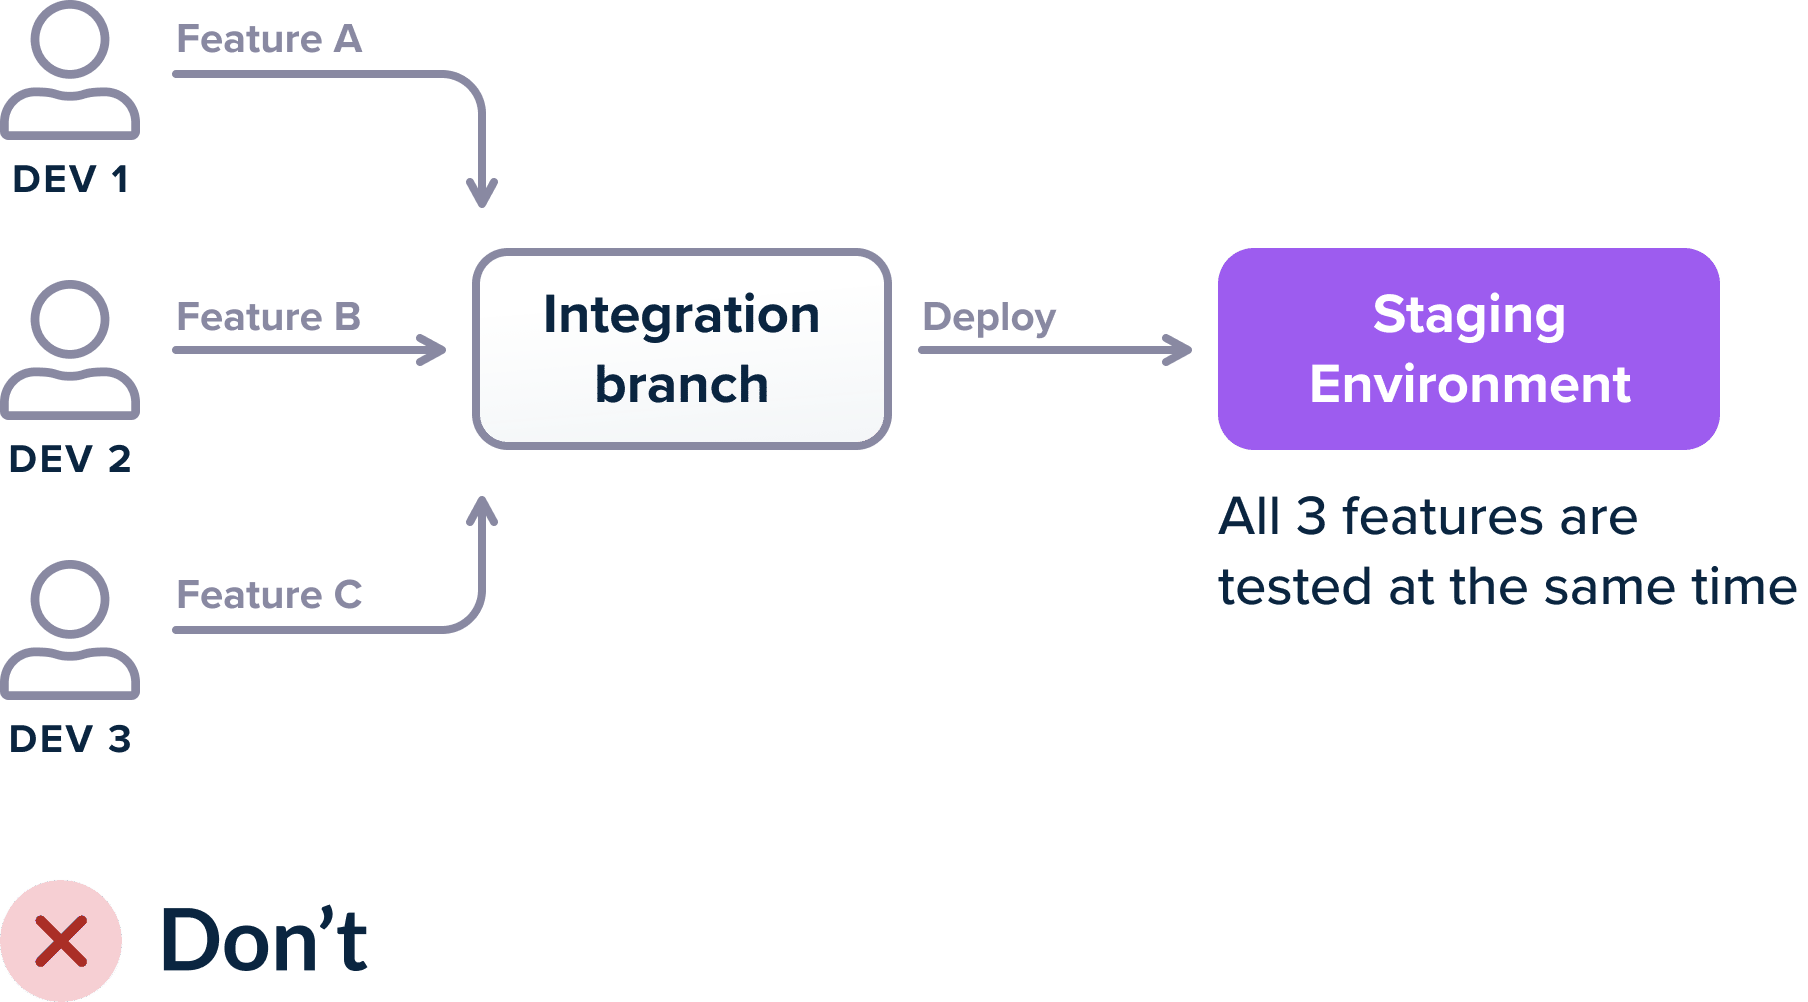
If you use a single environment for integration then when multiple developers merge features and something breaks, it is not immediately which of the feature(s) caused the problem. If 3 developers merge their features on a staging environment and the deployment fails (either the build fails, or the integration tests fail or the metrics explode) then there are several scenarios:
- Feature A is problematic, B and C are fine
- Feature B is problematic, A and C are fine
- Feature C is problematic, B and C are fine
- All features are fine on their own, but the combination of A and B is problematic
- All features are fine on their own, but the combination of A and C is problematic
- All features are fine on their own, but the combination of B and C is problematic
- All features are fine on their own, but the combination of all 3 is problematic
Depending on the size of your programming team and the complexity of your software, distinguishing between these scenarios is a lengthy process. If a GUI button changes position it is probably easy to find out which developer is responsible for the commit. But if your recommendation engine suddenly became 5x slower, how quick can you identify the responsible feature if all 3 developers worked on the recommendation engine for this sprint?
To overcome this problem, companies almost always adopt the “booking paradigm”:
- The staging environment is “booked” by each individual developer so that they can test their feature in isolation.
- The company creates multiple “staging” environments that developers use for testing their features (as a single environment can quickly become a bottleneck).
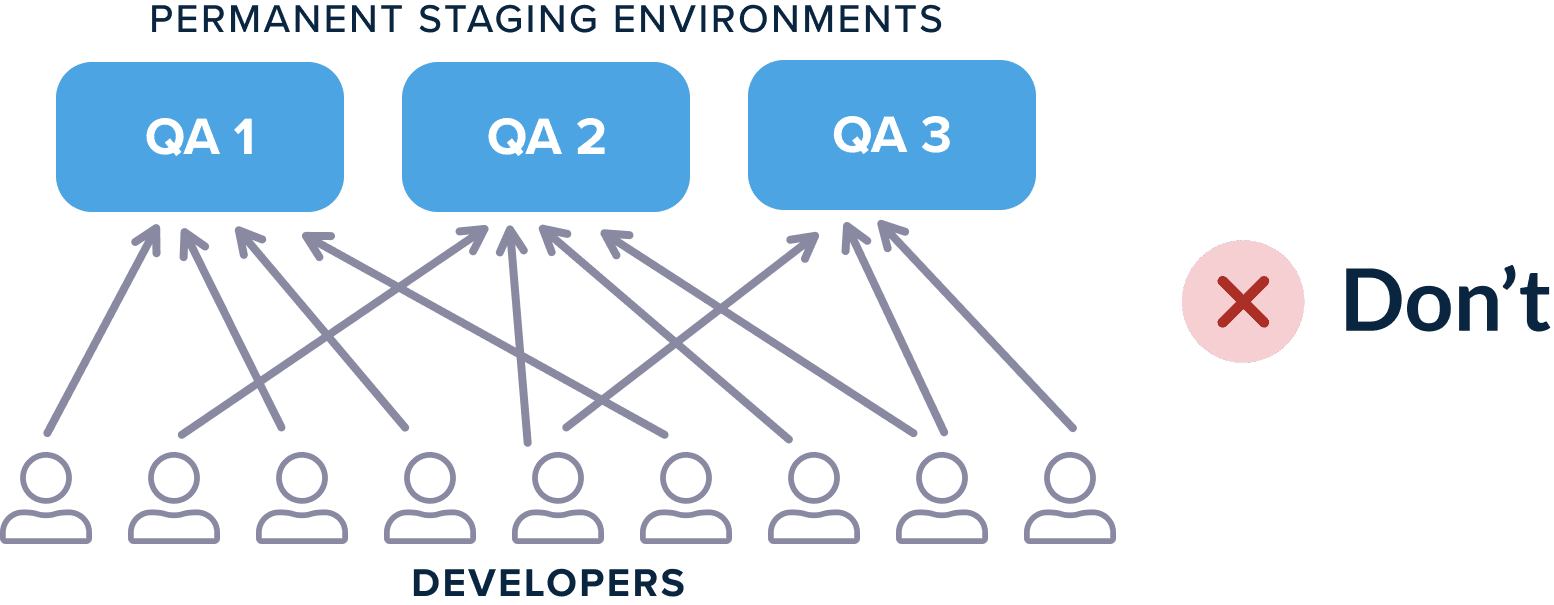
This situation is still problematic because developers not only have to coordinate between themselves for choosing environments, but also because you have to keep track of the cleaning actions of each environment. For example, if multiple developers need a database changeset along with their feature, they need to make sure that the database of each staging environment contains only their own changes and not the changes of the previous developer that used that environment.
Additionally, multiple permanent staging environments can quickly suffer from the well known problem of configuration drift where environments are supposed to be the same, but after several ad-hoc changes, they are not.
The solution of course, is to abandon the manual maintenance of static environments and move to dynamic environments that are created and destroyed on demand. With Kubernetes this is very easy to accomplish:
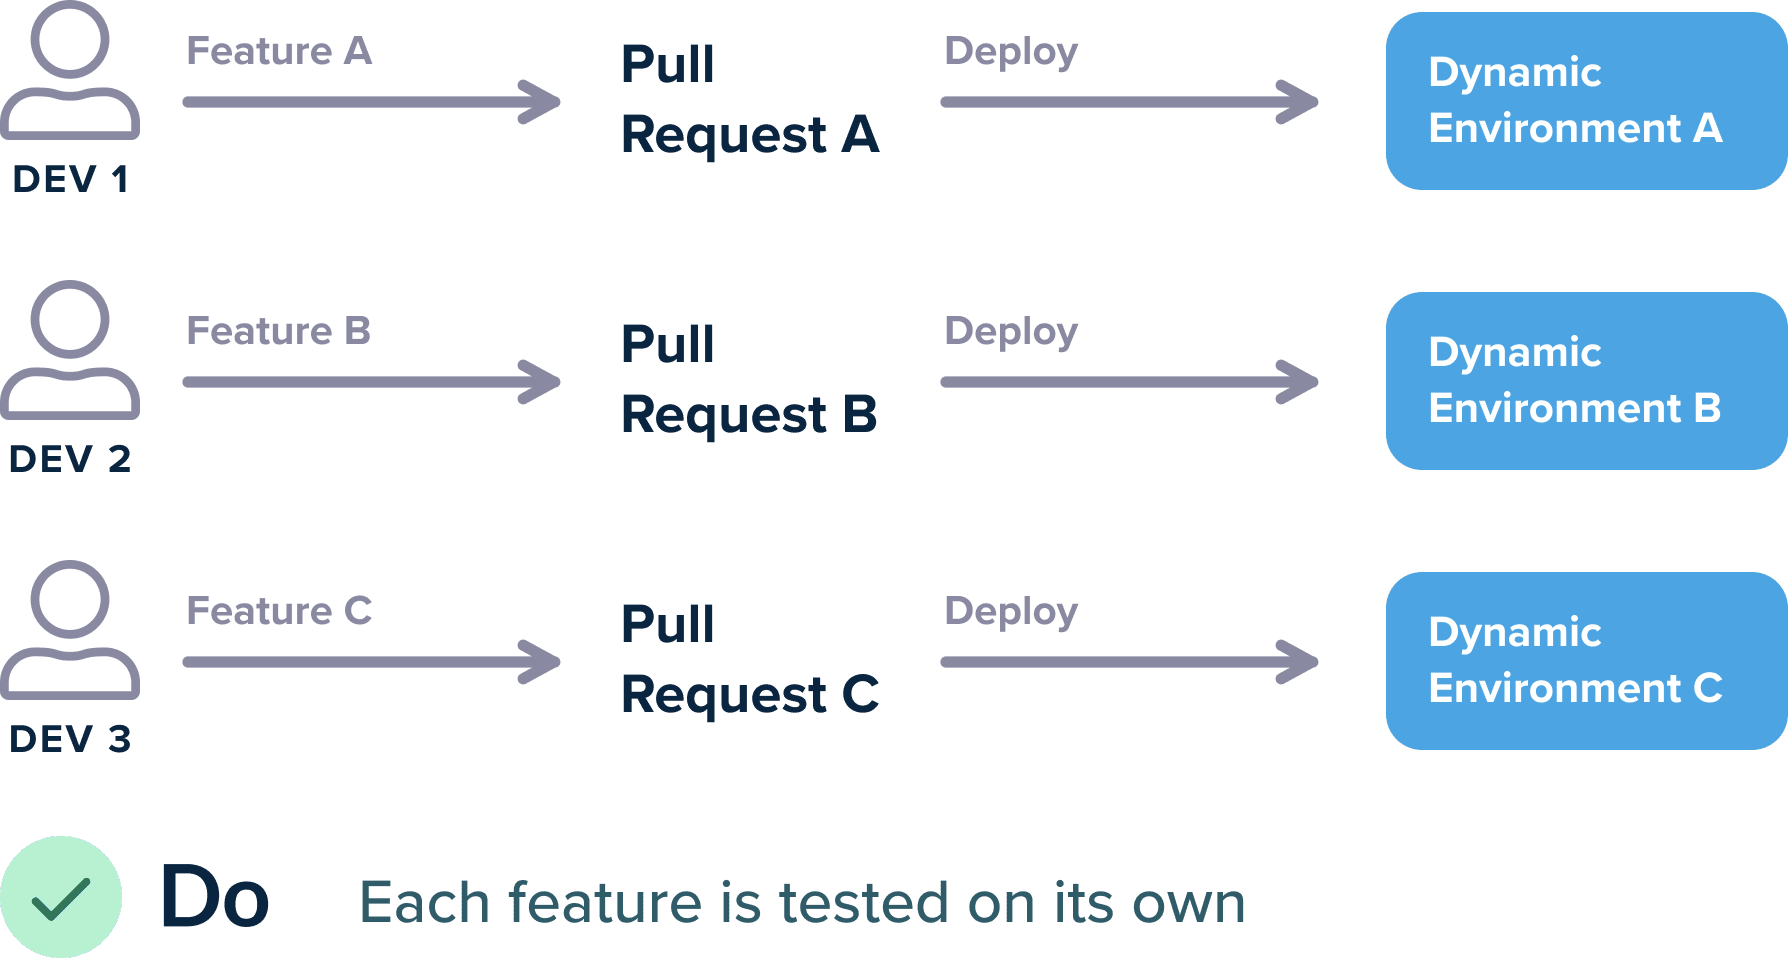
There are many ways to achieve this scenario, but at the very least every Open Pull Request should create a dynamic environment that contains only that Pull Request and nothing else. The environment is automatically destroyed when the pull request is merged/closed or after a specified amount of time.
The big strength of automatic environments however is the complete freedom of developers. If I am a developer and just finished with feature A and my colleague finished feature B, I should be able to do:
git checkout master
git checkout -b feature-a-b-together
git merge feature-a
git merge feature-b
git push origin feature-a-b-together
And then magically a dynamic environment should be present at: feature-a-b-together.staging.company.com or staging.company.com/feature-a-b-together.
Behind the scenes you can use Kubernetes namespaces and ingress rules for this isolation.
Note that it is ok if your company has permanent staging environments for specialized needs such as load testing, security penetration analysis, A/B deployments etc. But for the basic scenario of “I am a developer and want to see my feature running and run integration tests against it”, dynamic environments is the way to go.
If you are still using permanent environments for feature testing you are making life hard for your developers and are also wasting system resources when your environments are not actively used.
Anti-pattern 9 – Mixing production and non-production clusters
Even though Kubernetes is specifically designed for cluster orchestration you shouldn’t fall into the trap of creating a single big cluster for all your needs. At the very least you should have two clusters, a production one and a non-production one.
First of all, mixing production and non-production is an obvious bad idea for resource starvation. You don’t want a rogue development version to overstep on the resource of the production version of something.
But as far as developers are concerned the biggest problem has to do with security. Unless you take active steps against it, all communication inside a Kubernetes cluster is allowed by default. And contrary to popular belief a pod from one namespace can freely communicate with a pod on another namespace. There are also some Kubernetes resources that are not namespaced at all.
Kubernetes namespaces are not a security measure. If your team has advanced Kubernetes knowledge then it is indeed possible to support multi-tenancy inside a cluster and secure all workloads against each other. But this requires significant effort and in most cases, it is much simpler to create a second cluster exclusively for production.
If you combine this anti-pattern with the second one (baking configuration inside containers) it should be obvious that a lot of bad scenarios can happen.
The most classic one:
- A developer creates a feature namespace on a cluster that also houses production
- They deploy their feature code in the namespace and start running integration tests
- The integration tests write dummy data, or clean the DB, or tamper with the backend in a destructive manner
- Unfortunately the containers had production URLs and configuration inside them, and thus all integration tests actually affected the production workloads!
To avoid falling into this trap, it is much easier to simply designate production and non-production clusters. Unfortunately several tutorials imply that namespaces can be used for environment division and even the official Kubernetes documentation has examples with prod/dev namespaces.
Note that depending on the size of your company you might have more clusters than two such as:
- Production
- Shadow/clone of production but with less resources
- Developer clusters for feature testing (see the previous section)
- Specialized cluster for load testing/security (see previous section)
- Cluster for internal tools
No matter the size of your company you always should have at least 2 (production and everything else that is not production).
Anti-pattern 10 – Deploying without memory and cpu limits
By default an application that is deployed to Kubernetes has no specified resource limits. This means that your application can potentially take over the whole cluster. This would be problematic in a staging cluster and catastrophic in a production cluster as the slightest memory leak or CPU hiccup will wreak havoc in the rest of the applications.
This means that all your applications (regardless of the target cluster) should have associated resource limits.
Maybe as a developer you don’t need to know all the details on how the limits are set, but it is your responsibility to give some hints and advice to the person that is managing your cluster on what are the expectations of the application.
Unfortunately, simply looking at the average memory and CPU usage of an application is not enough. Average resources are just that – average. You need to examine your application and see with bursts of traffic and load and understand what is the behaviour of the resources under extreme conditions. After all, this is exactly the kind of condition that you don’t want your application to be restarted without reason.
One of the benefits of Kubernetes is the elasticity of resources. If the cluster is killing/restarting your application just when it is starting to handle significant load (because let’s say your eshop is getting hammered with traffic), you have lost the advantage of using a cluster in the first place.
On the other hand, setting too high limits is a waste of resources and makes your cluster less efficient.
You also need to examine your programming languages for specific usage patterns and how resources are used by the underlying platform. Legacy Java applications for example have notorious problems with memory limits.
Note that once you gain confidence with your application and how it uses Kubernetes resources you can also automate the whole resource game with a vertical cluster auto-scaler.
Continued on part 3.
Download the ebook.
Cover photo by Unsplash.
