The container ecosystem is moving very fast and new tools designed specifically for Kubernetes clusters are introduced at a very fast pace. Even though several times a new tool is simply implementing a well-known mechanism (already present in the VM world) with a focus on containers, every once in a while we see tools that are designed from scratch rather than adapting a preexisting idea. One such tool is Komodor.
It is hard to describe Komodor in a single sentence because it is unlike any other existing tool. Komodor is a Kubernetes troubleshooting tool specifically designed for developers. It is a smart dashboard that combines a live view of your cluster with several integrations for other tools (such as metric providers) that you already have installed.
The goals of Komodor are centered around an easy understanding of what is running on your cluster, what has recently changed, how it was changed, and by whom. And by change, we mean all kinds of changes such as new deployments, feature flags, adhoc kubectl commands, health checks, and everything else that affects your cluster.
If during an incident (or even under normal circumstances) you have struggled with questions such as:
- What was the last time that application X was deployed?
- What manifests were changed yesterday at 5.00 pm?
- How do I find the CI pipeline responsible for application Y?
- Who changed the configuration of application Z that is a dependency of your own app?
then Komodor is here to help you!
Giving developers the information they really need
Before diving into the features of Komodor it is important to understand the mindset behind Komodor as it is essentially a tool that doesn’t belong to any existing categories of tools.
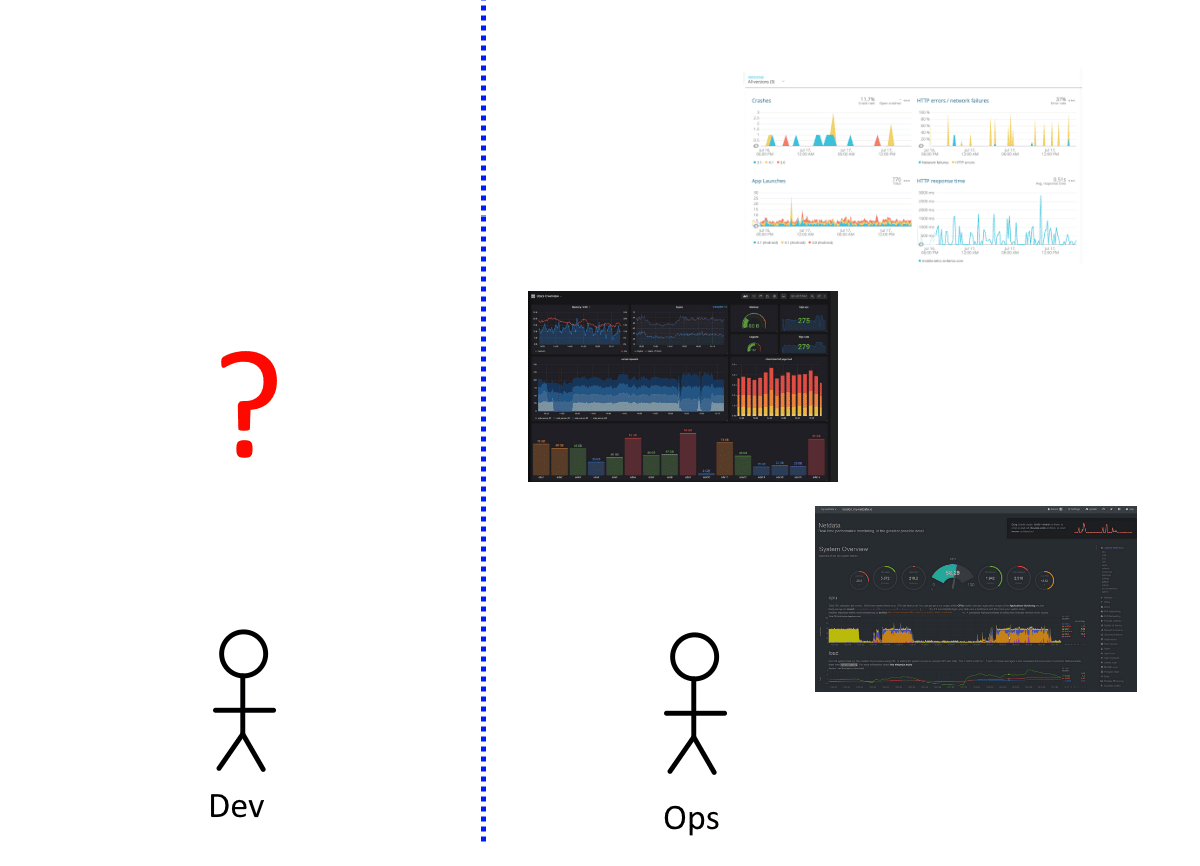
When something goes wrong in your cluster, your first impulse is to check your metrics solution. Having metrics enabled for your cluster is a great practice but it is not always enough to troubleshoot issues (especially if it is 3.00 am and you have just woken up looking at a cluster that you are not familiar with).
Current metric solutions share some common characteristics:
- Most of them were existing tools created for bare-metal and VMs and simply adapted their functionality for containers with mixed success
- They are great at telling you what changed but not why and by whom
- Most of the time they offer much information that is not relevant to all cases and it is up to the human to understand which information is important and which is not
The problem is further exacerbated by the fact that most existing metric solutions are targeted at operators:
The process of troubleshooting a Kubernetes cluster as a developer is particularly difficult with the existing tools. As a developer, you don’t care about Persistence volumes or DNS errors or expired certificates. These problems are not normally solved by developers anyway.
Developers however do care about:
- Failed deployments
- Errors because a feature flag was enabled
- Communication errors that have been caused not by the deployment itself but by a dependency of the application that is being deployed
- Rogue manifest changes that are not happening via CI/CD
Komodor bridges this gap by giving you a tool specifically for Kubernetes clusters and specifically for all things important to developers. You can also use Komodor if you are an operator and link it to your existing tools.
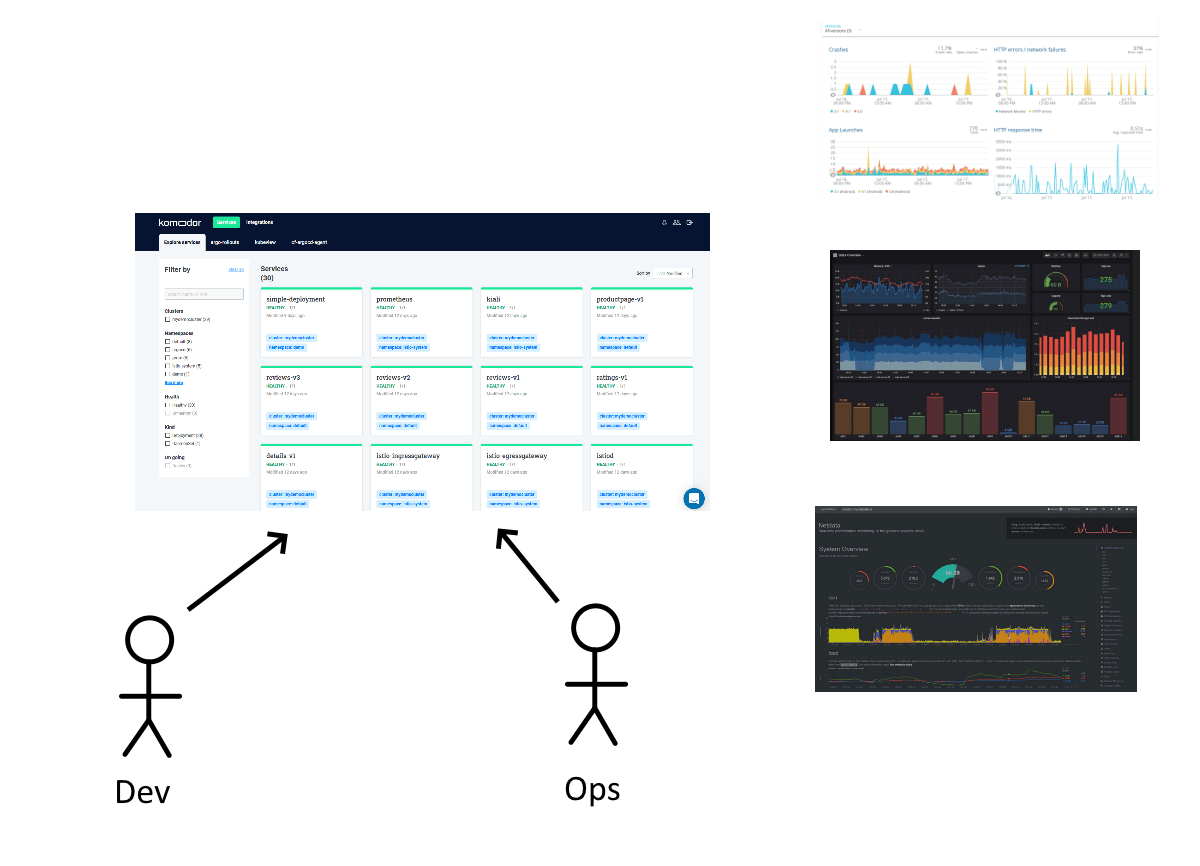
Helping developers and operators collaborate and share a common language for solving issues is at the heart of DevOps.
How Komodor works
Komodor is offered as a hybrid application. The web UI runs in the cloud and is managed by the Komodor team. You need to install in your cluster the komodor agent as a Helm chart that then pushes information with the cloud UI. This means that communication for your cluster is outgoing only. There is no need to open any ports in your firewall or modify your allowlist with specific port ranges.
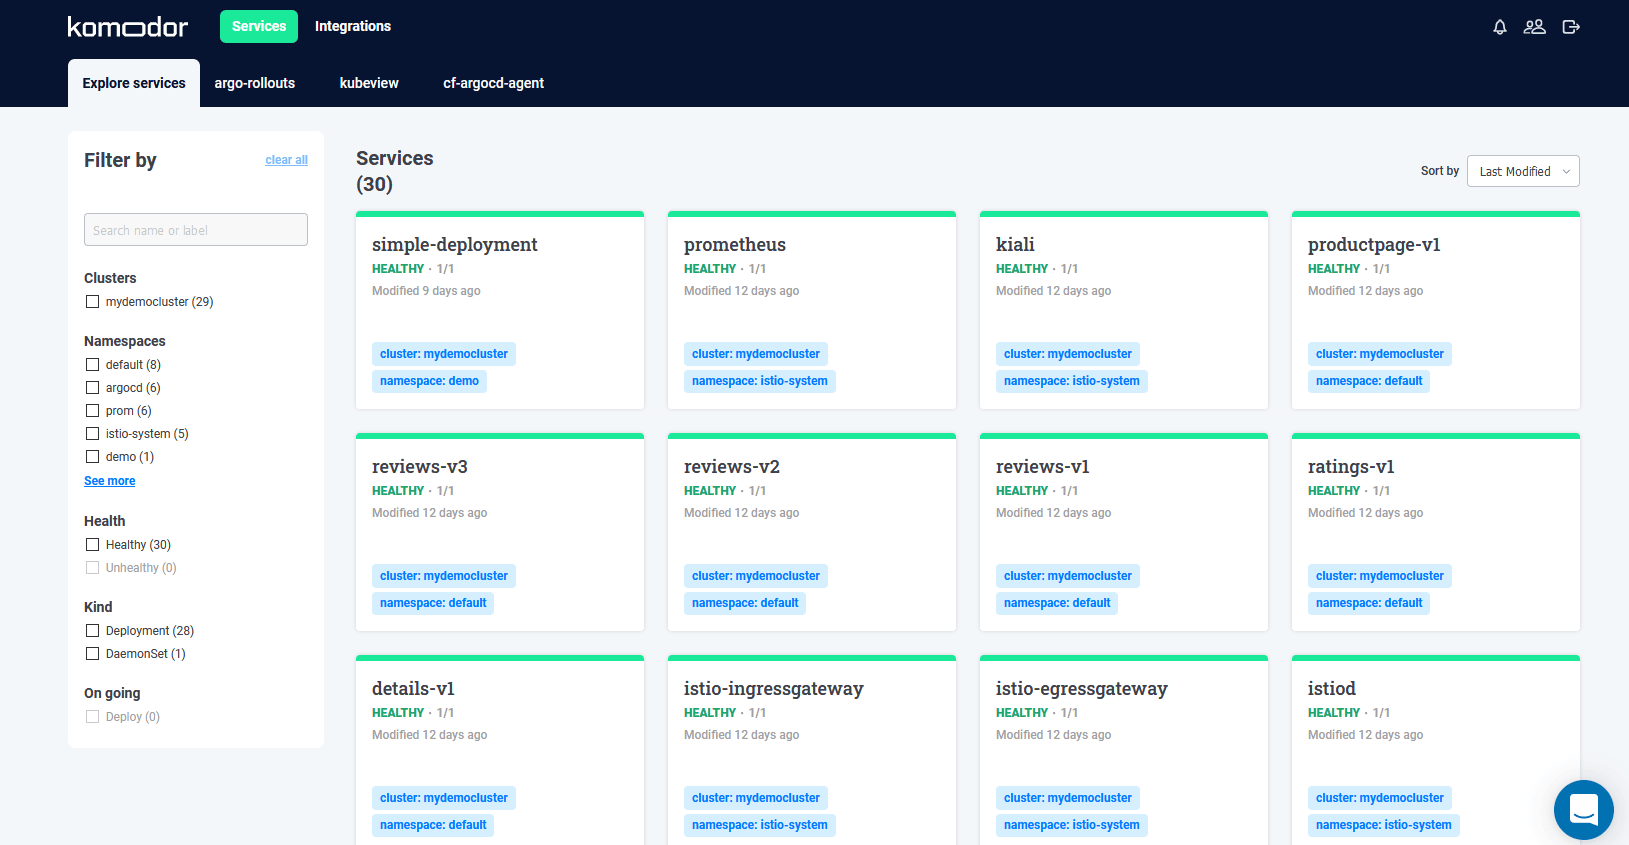
Once your agent is installed successfully your dashboard will be automatically populated. From now on Komodor is monitoring several events in your cluster and the web UI is updated in real time.
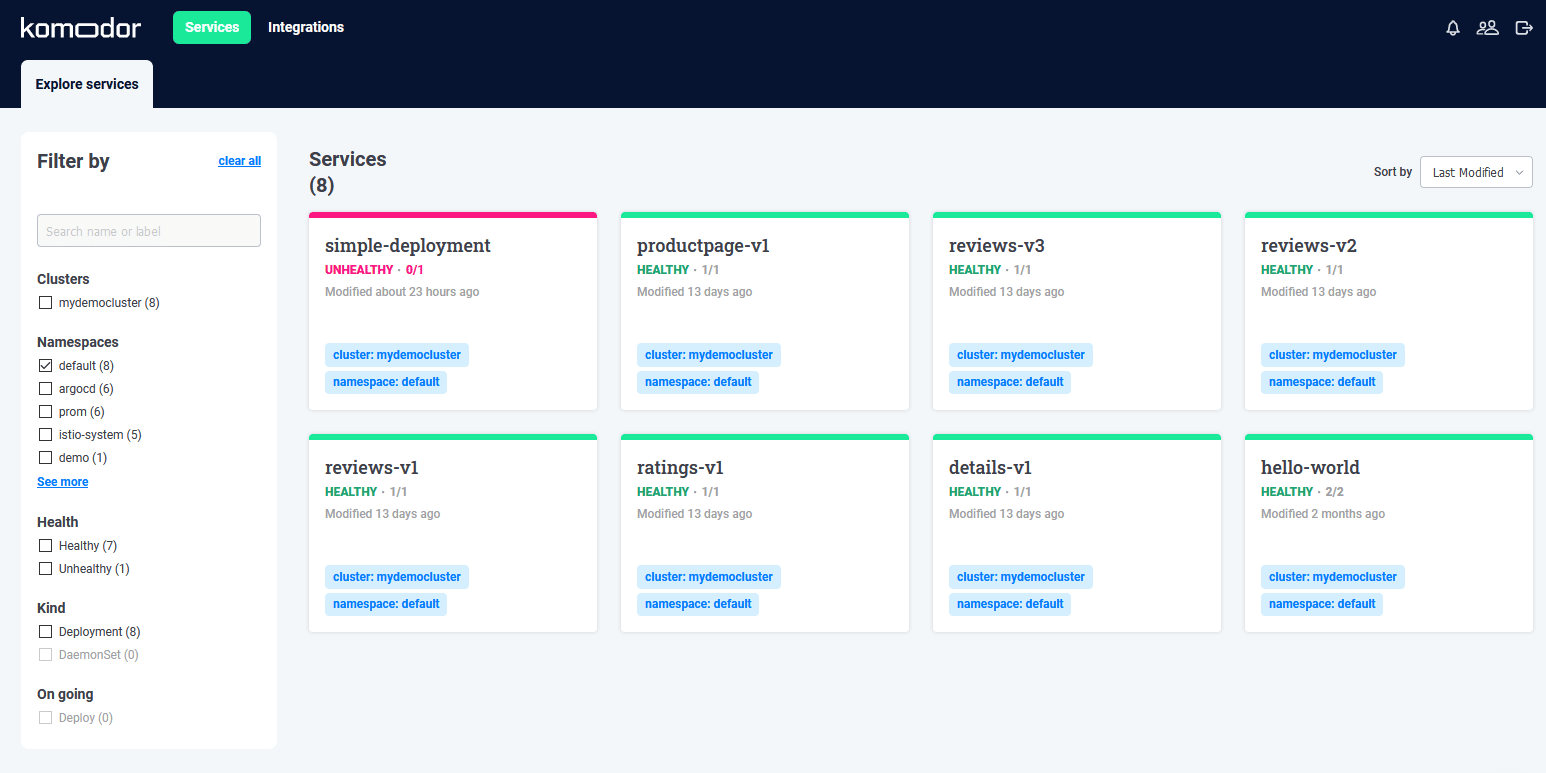
Currently Komodor supports Deployments, Daemonsets and StatefulSets. The left sidebar has a list of all your namespaces along with some extra information as we will see later on.
Support for custom CRDs is something that may come in the future.
Using the Komodor timeline
At the heart of Komodor is the event timeline. If you click on any service/deployment from your dashboard you will see the complete timeline for this service (from the time the Komodor agent was installed of course)
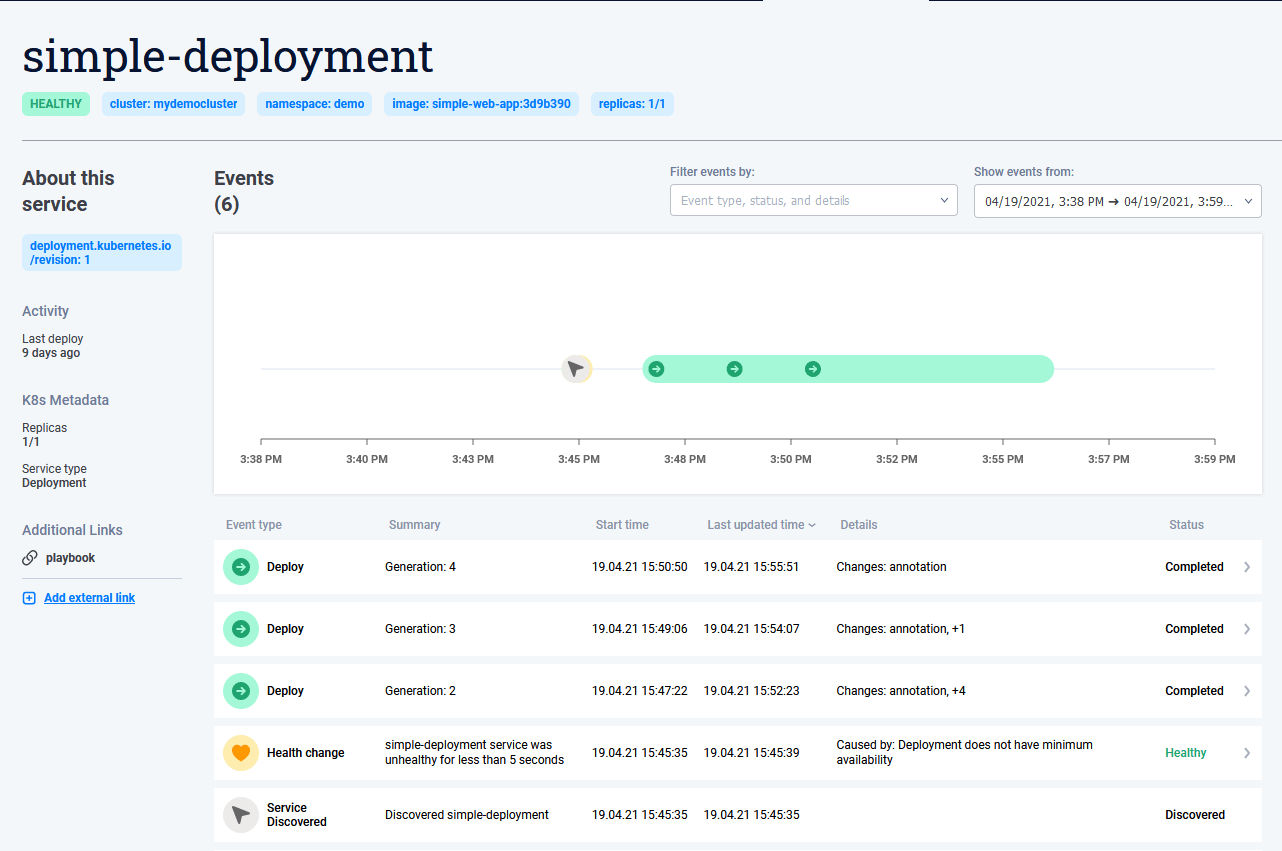
The timeline is one of the major advantages for Komodor because it captures all events that affect your application. Out of the box Komodor monitors your application for restarts, replica changes, manifest changes, health status changes and so on. By adding extra integrations you can also add in the timeline events from external providers (e.g. get alerts from Graphana, New Relic or Datadog).
The beauty of this mechanism is that Komodor can understand ALL events that happened in your application regardless of their source. This comes in contrast with other Kubernetes tools that only know about their own events and don’t have the full picture of what was changed when.
As an example for a single application the following might happen:
- The deployment image was upgraded by your CI/CD system
- The pod autoscaler changed the amount of replicas to better handle traffic
- An alert was created by New Relic
- A system administrator changed manually a manifest via kubectl
Komodor will gather all of these events and present them in the same timeline in chronological order. This gives you great insight into what is happening with a single service without having to jump between different applications and dashboards.
The last case is very important as this means that Komodor will catch even adhoc changes performed manually in the cluster (e.g. with kubectl edit).
In the example below I have manually changed the replicas with kubectl without deploying a new version via CI/CD. Komodor not only identifies the manifest and marks it as “change replicas” in the timeline, but also provides me with a detailed diff on what changed.
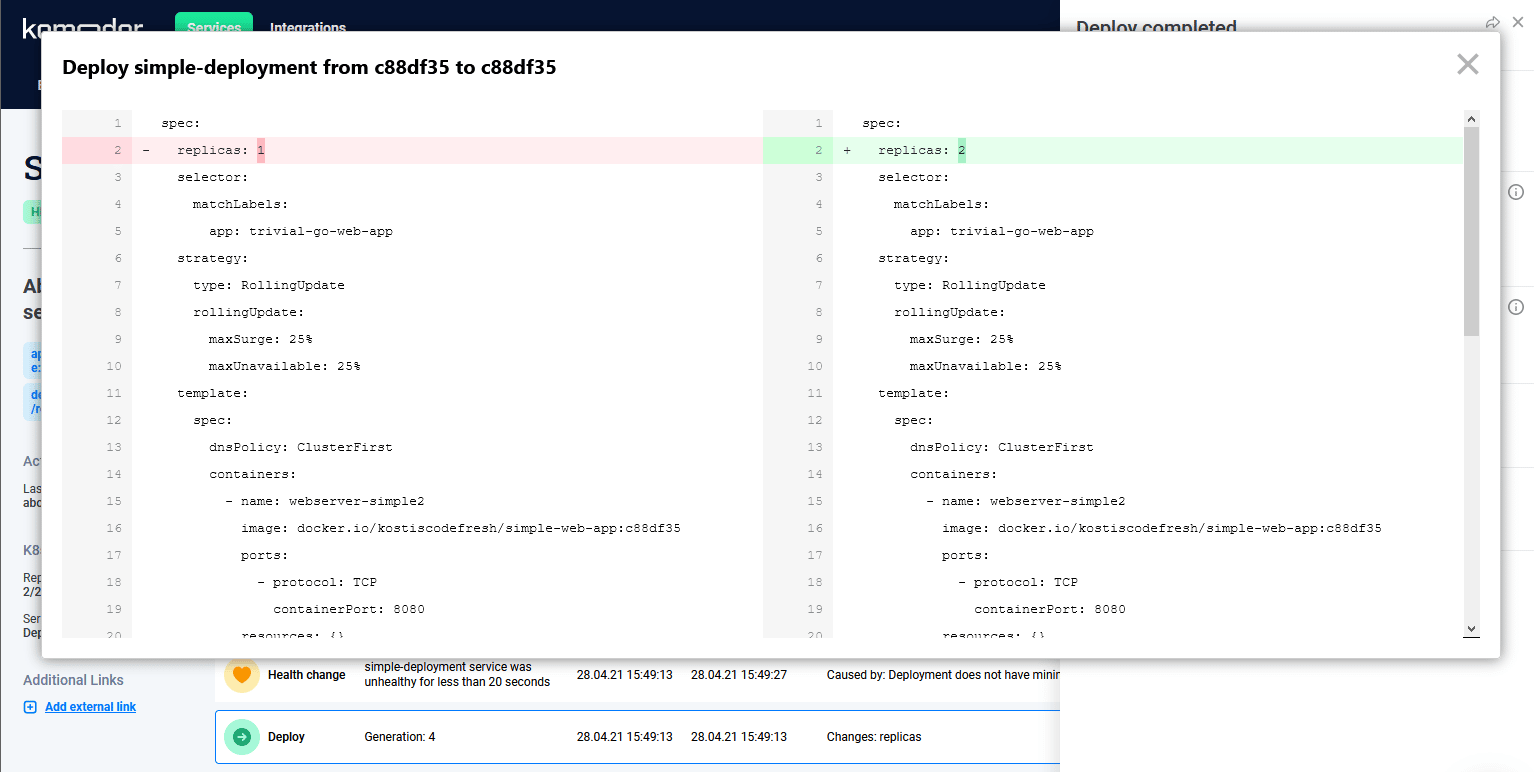
Detecting manual configuration changes is very important as they can be responsible for failed deployments (the well known phenomenon of configuration drift). Several times after a failed deployment developers will waste time by thinking about issues with their code, while in reality the problem was that somebody changed the cluster or the application in an un-audited manner.
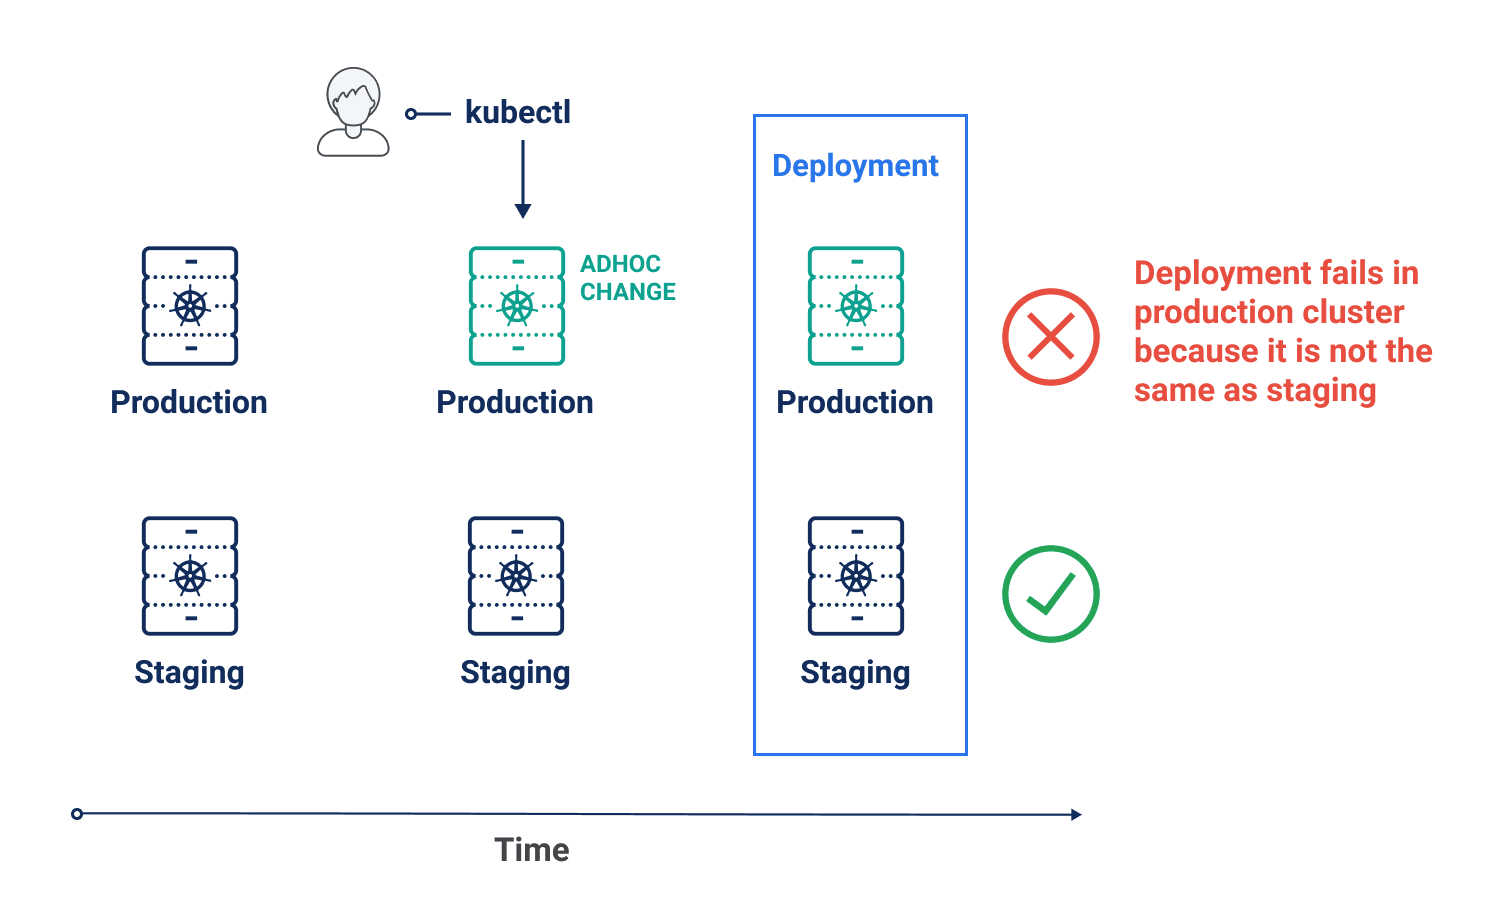
With Komodor it is now possible to see both planned and unplanned changes in the same pipeline.
Correlating events between related services
Looking at each service on its own offers great insight into what your application is doing at all times. However, the true power of Komodor becomes more apparent when you select multiple services either from the same namespace or from different namespaces.
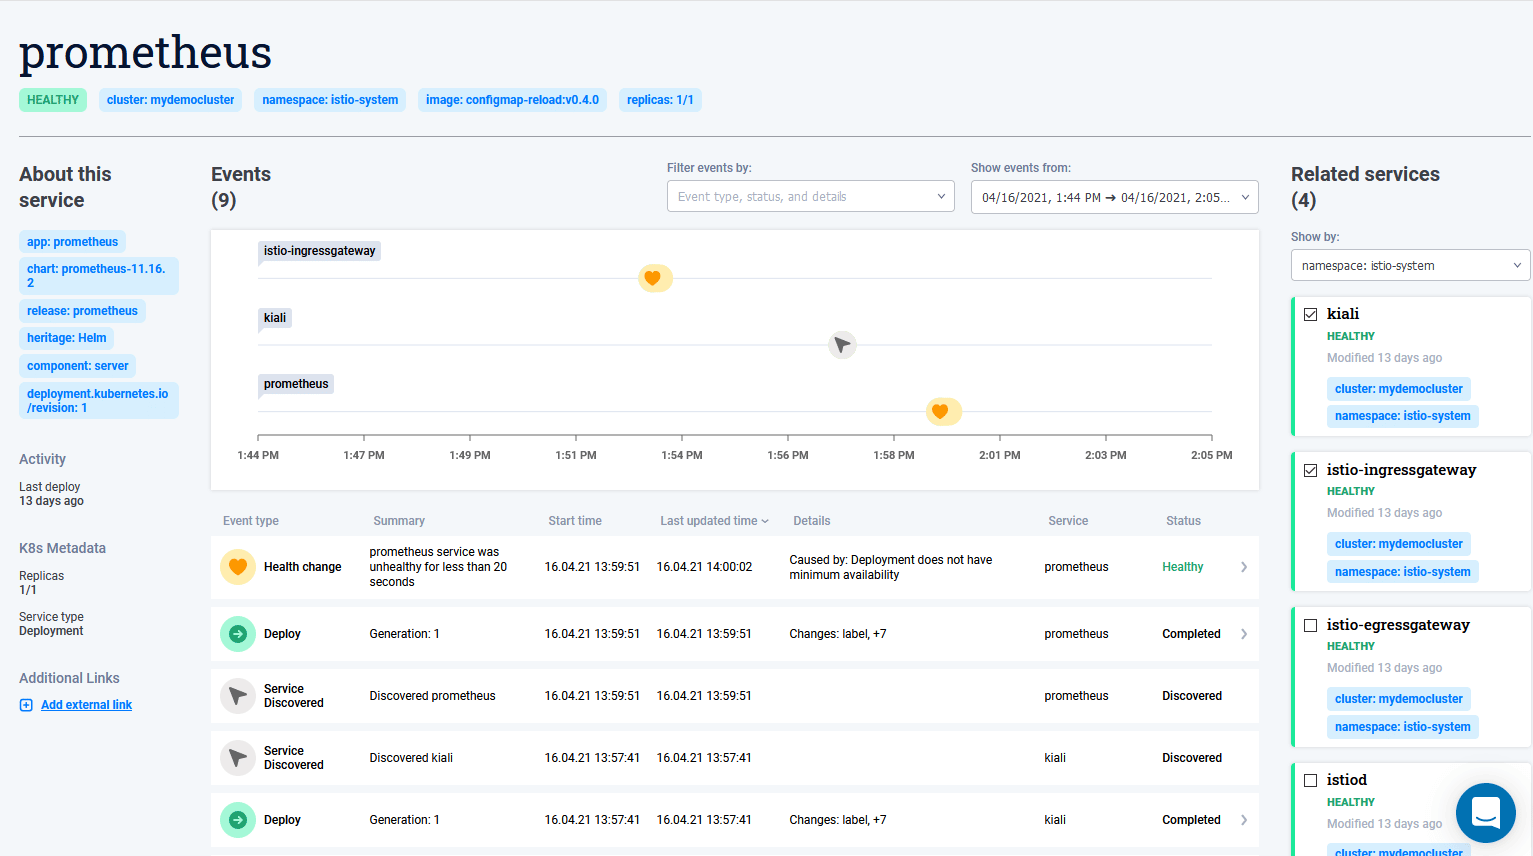
Komodor then will do a smart merge of all events and present you a unified timeline with the events of all selected services (still in chronological order among them).
The importance of this view cannot be overstated. The health of a service might be affected by other dependent services, so having this unified overview is a timesaver for detecting issues not with a service itself but with its dependencies.
If you have ever been on call you might recognize the following scenario:
- You are paged at 3.00 am in the morning to fix an issue with application A, an application that you are already familiar with
- You check your dashboards and realize that no deployment has happened for application A in the last week. Then you start looking for configuration changes and your Git history says that no configuration changes have been made lately.
- Getting the hint that another dependent service might be the issue you start looking at other dependent projects B, C, D etc which is a time consuming process
- Since you are not familiar with the dependent projects you need to ask other people (and possibly wake them up) in order to see if their configuration was changed or not. You also spend extra time to check the CI/CD pipelines for those services.
- This process can continue in more depth (i.e. check transitive dependencies of your dependencies)
- In the end you find out that earlier that day a sys admin from an unrelated team did a manual change (not recorded with CI/CD) in a dependent service that resulted in your application failing over the next hours.
Having Komodor in place can cut down this process from several hours to some minutes. Now you can simply gather all dependent services in a single timeline and see exactly what happened with all of them including manual changes.
You can make this process even easier if you help Komodor understand what “related services” means for you. While you can always manually select additional services that you consider related, Komodor has native integration for Kiali/Istio and Datadog that will automatically look at network dependencies between services and understand all the dependencies between your services.
Annotating your applications with extra metadata
In the previous section we talked about how Komodor detects manifest changes automatically and can even present you a diff on what changed.
But what about application changes? In most cases (especially if you are following GitOps) the application source code is in a separate Git repository that has nothing to do with the repository that holds your manifests.
Komodor has native integration with Github in the form of extra annotations. By annotating your deployments with extra information for the Git repositories that comprise your application Komodor can communicate with GitHub and present you with diff for both application code AND manifests. This is a huge advantage when it comes to troubleshooting, as you can follow both infrastructure and code changes all at once.
Here is an example of the annotations.
apiVersion: apps/v1
kind: Deployment
metadata:
  annotations:
    app.komodor.com/app: https://github.com/kostis-codefresh/gitops-app-source-code
    app.komodor.com/app.ref: refs/heads/dummy
    app.komodor.com/deploy.job.jenkins: https://codefresh.io
    app.komodor.com/infra: kostis-codefresh/gitops-kubernetes-configuration
    app.komodor.com/infra.ref: refs/heads/master
    app.komodor.com/pipelines: https://github.com/kostis-codefresh/gitops-pipelines
    app.komodor.com/pipelines.ref: HEAD
And here is the extra information in the UI
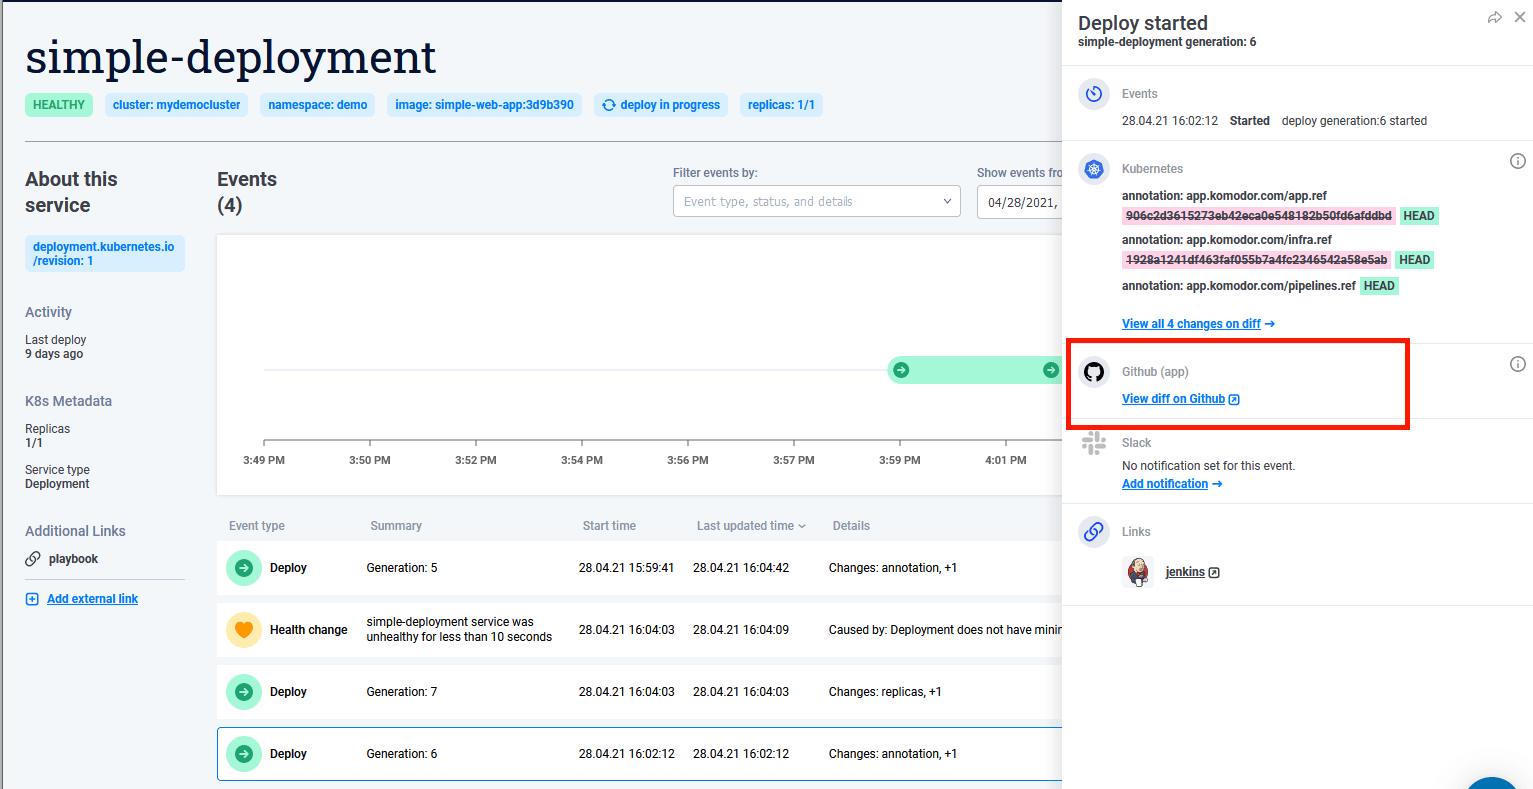
Notice that Github information is just one example of annotations that you can add to your service. Komodor supports other types of annotations such as links to your metrics, your alert provider, your CI pipeline, your playbook and so on.
This means that with Komodor you can easily explore a cluster that you are not familiar with. And instead of hunting down information in slack channels or company wikis (or even worse having to wake up people in the middle of an incident) you have all the information at hand right within Komodor.
If you think you have seen this type of annotation before you are not mistaken. They are also used by Ambassador for creating a developer portal. Right now Komodor introduces its own annotations, but in the future it would be great if we have a common standard for this type of information.
Recovering from incidents with Komodor
I hope that you now have a good idea on what Komodor offers. It is not a replacement for your metrics or alerts. It complements them both by offering a unified dashboard for your cluster with the information that you need specifically for Kubernetes applications:
- An overview of all services and their health
- A comprehensive timeline for all events that affected your service (even adhoc changes)
- A way to group related services and merge their timeline together
- Information on both infrastructure and application code changes in the same dashboard
- A way to add extra annotations to your services for handy links to CI, playbooks, metrics etc.
Komodor will change the way that you manage incidents and depending on the amount of effort you assign to it (particularly with external integrations) you can cut down significantly the amount of time wasted looking for information during an incident.
To start exploring Komodor and change the way you troubleshoot your Kubernetes applications, join us for our Webinar on September 1!