Editor’s Note: This blog was co-authored by Josh Henrick from Rookout and Anais Urlichs from Codefresh. Josh & Anais recorded a webinar on this very topic! Watch the webinar now.
As all developers know, when building software things don’t always go as planned. In fact, most of the time they don’t. With today’s modern distributed architectures it’s more important than ever to have the proper tools in your toolbelt. This allows us to automate as much of the software delivery lifecycle as possible and then be able to immediately triage issues when they arise.
Automate the Workflow
In this post, we’ll dive deeper into a hands-on example of how you can survive potential disasters by having the ability to quickly and easily debug a remote application using Rookout. Rookout is a debugging solution that empowers engineers to solve customer issues faster by allowing them to debug their application quickly and easily in any environment. Additionally, we will be using Codefresh to automate your build and delivery velocity. Codefresh is a CI/CD platform that makes DevOps extremely easy. With native Docker, Kubernetes, and Helm support, it will allow us to easily deploy a new application.
Rookout debugger with a non-breaking breakpoint set
In the end, our application will be directly connected to our Rookout account. This will make live debugging a breeze. Additionally, with every git commit, the updated version of our application will be automatically deployed to our Kubernetes cluster through our Codefresh pipeline.
This is what we are going to do:
- Prepare an example application and our Codefresh Environment
- Set-up our Rookout environment to connect our application upon deployment with Rookout
- Set-up our Codefresh pipeline to automate the process of deploying our application with a custom Helm step
Prepare example application
For this example, we are going to be using Rookout’s example todo application that has been written in Python. It will not only provide us with several methods that are running in the backend but also with a visual display of the content. Rookout supports several language families including Java, .NET, Python, Node.js, and Ruby. You can find a set of deployment examples here or by language in the Rookout documentation if you would like to set up the SDK in your own application.
First, go ahead, and fork the repository, then clone the application and change to the codefresh-demo branch:
$ git clone https://github.com/anais-codefresh/tutorial-python.git
$ git checkout codefresh-demo
This repository uses a Helm chart to deploy our application to our Kubernetes cluster. The values at the end of our values.yaml file allows us to connect our running application to Rookout:
rookouttoken: "your_token"
origin: "your_repository"
gitcommit: "your_branch"
Once we run our pipeline, we are going to be passing in those variables. The same variables are going to be reused as environment variables in our /tempaltes/deployment.yaml file. If you are using your own application, please ensure that those values can be passed into the application.
This is all that we have changed in our Helm Chart. Moving back to the main directory, we can find a file called codefresh.yml which defines our Codefresh pipeline. The pipeline will be needed in the next step.
Prepare Codefresh account
If you do not have a Codefresh account yet, now is the time to create your free account!.
Prerequisites:
- To build the container image of our application and push it to a container registry, we have to connect a Docker Registry to our Codefresh account. In our case, we have connected a Dockerhub account to Codefresh.
- Once we have connected our container registry, we have to connect to our Kubernetes Cluster. Again, Codefresh allows you to connect to any providers so the decision is yours. The documentation provides set-up instructions for the most popular cloud providers.
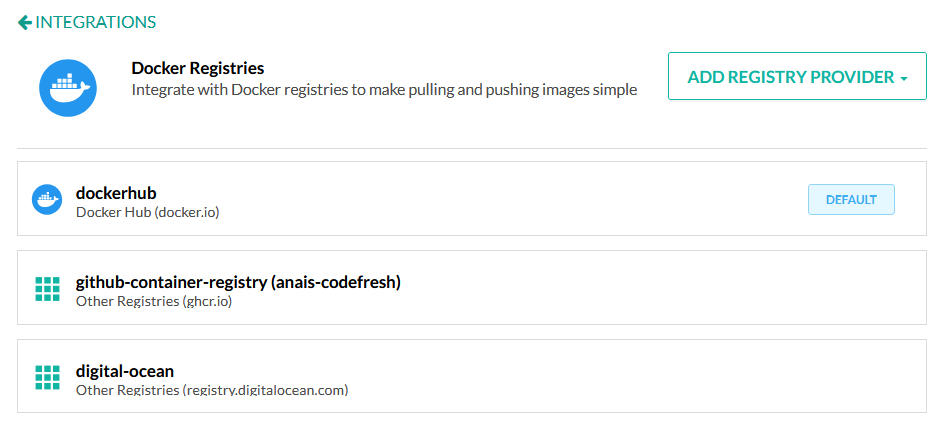
Codefresh Docker Registry Integration within the Account Settings
Set-up our Codefresh pipeline
Go to the ‘Project’ section and create a new project:
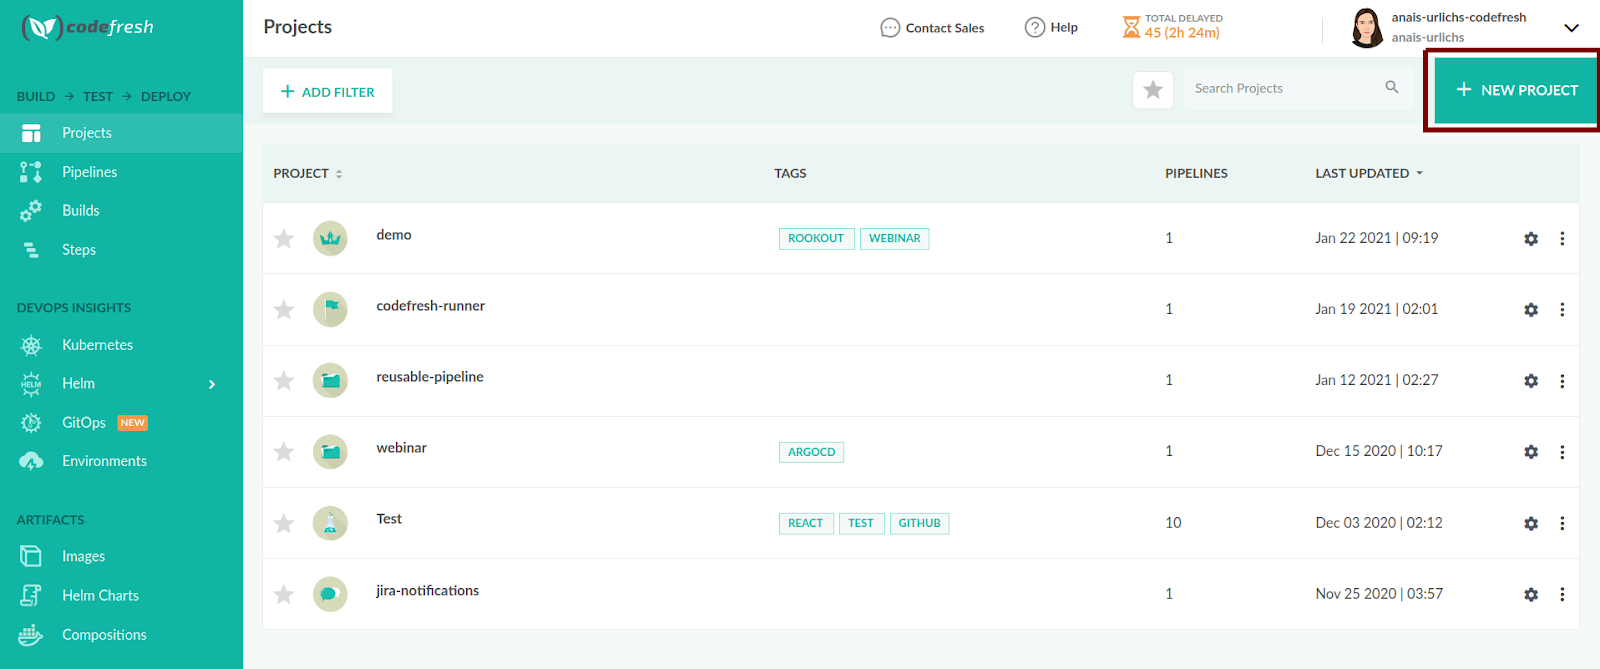
Start screen listing all available Codefresh projects
Once your project is set-up, we can go ahead and create our first pipeline:
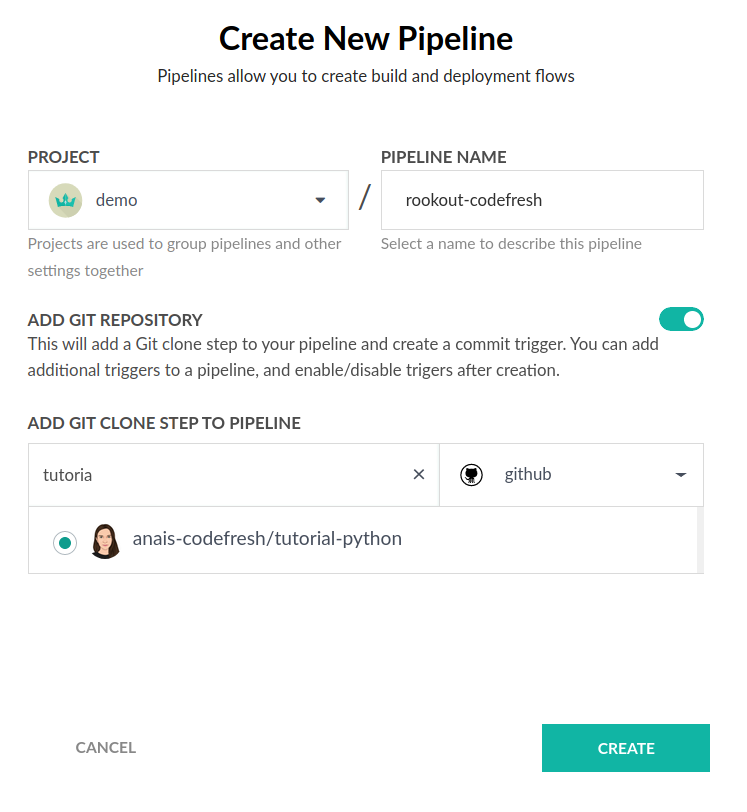
Make sure to select the repository of your cloned application.
Once you create the pipeline, you will be directed to the inline YAML file. Let’s have a look at our pipeline and the different steps within. In Codefresh, every pipeline step is its own container image. This makes it possible to run anything that can be run as or within a container image as a pipeline step.
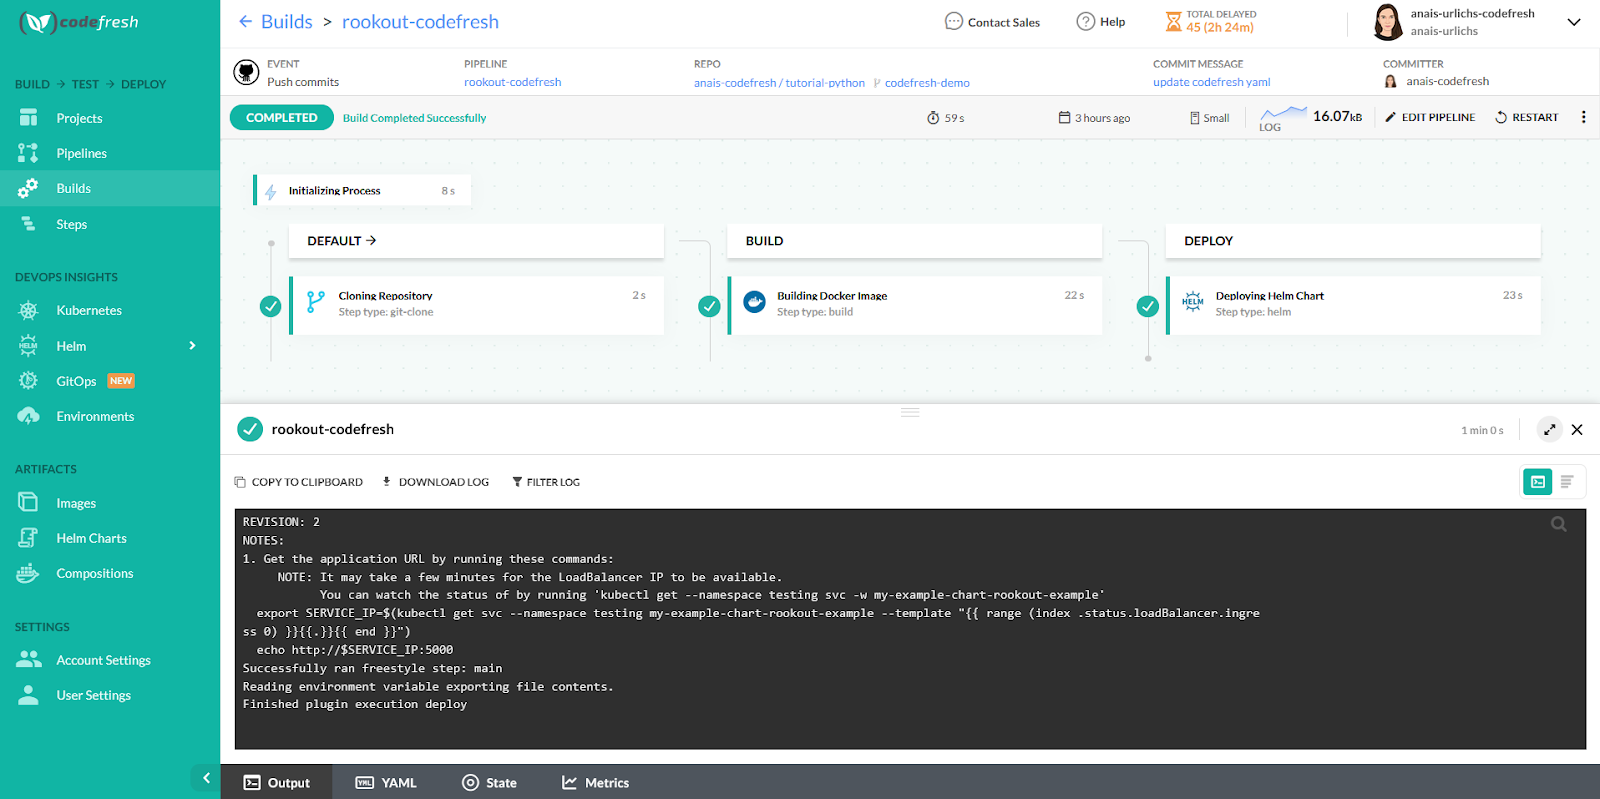
Codefresh pipeline after execution
We are going to replace any content that is currently within our inline YAML with the pipeline below. This is the same pipeline that you can find in the git repository.
version: "1.0"
stages:
   - clone
   - build
   - deploy
steps:
  clone:
      title: Cloning Repository
      type: git-clone
      repo: '${{CF_REPO_OWNER}}/${{CF_REPO_NAME}}'
      revision: '${{CF_REVISION}}'
  build_app_image:
      title: Building Docker Image
      type: build
      stage: build
      registry: "dockerhub"
      image_name: '${{REGISTRY_ACCOUNT}}/rookout-example'
      working_directory: "./${{CF_REPO_NAME}}"
      tag: '1.0.0'
      dockerfile: Dockerfile
  deploy:
      title: Deploying Helm Chart
      type: helm
      stage: deploy
      working_directory: './${{CF_REPO_NAME}}'
      arguments:
        action: install
        chart_name: charts/rookout-example
        release_name: my-example-chart
        helm_version: 3.0.2
        kube_context: '${{K8S_CLUSTER}}'
        namespace: testing
        custom_values:
          - 'rookouttoken=${{ROOKOUT_TOKEN}}'
          - 'gitcommit=codefresh-demo'
          - 'origin=tutorial-python'
- The first step ‘clone’ is responsible for cloning our git repository.
- The second step ‘build’ is responsible for building the container image of our application and pushing it to our container registry.
- The last step is a specific Helm step from our step marketplace that will deploy our application to our Kubernetes cluster like specified within our Helm chart.
You might have already realised that the YAML file contains several variables. These variables make it easy to reuse our pipeline across applications and across accounts. The variables starting with ‘CF’ are specific Codefresh variables and will be filled out automatically once our pipeline will run.
All other variables, we have to specify in the variables section within the Codefresh UI. Make sure that you replace the values with those applicable to your Rookout and Codefresh set-up. The next section will detail where you can find rookout-specific variables.
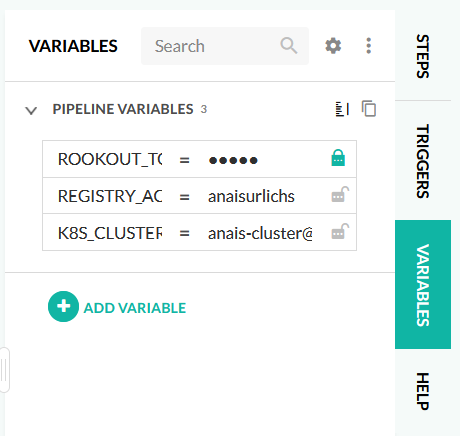
Variables used within our Codefresh Pipeline
Once filled out, our pipeline is ready to go. Save and Run our codefresh-demo branch. Once the pipeline is finished running, we should be able to see our deployed application in the Kubernetes Dashboard:
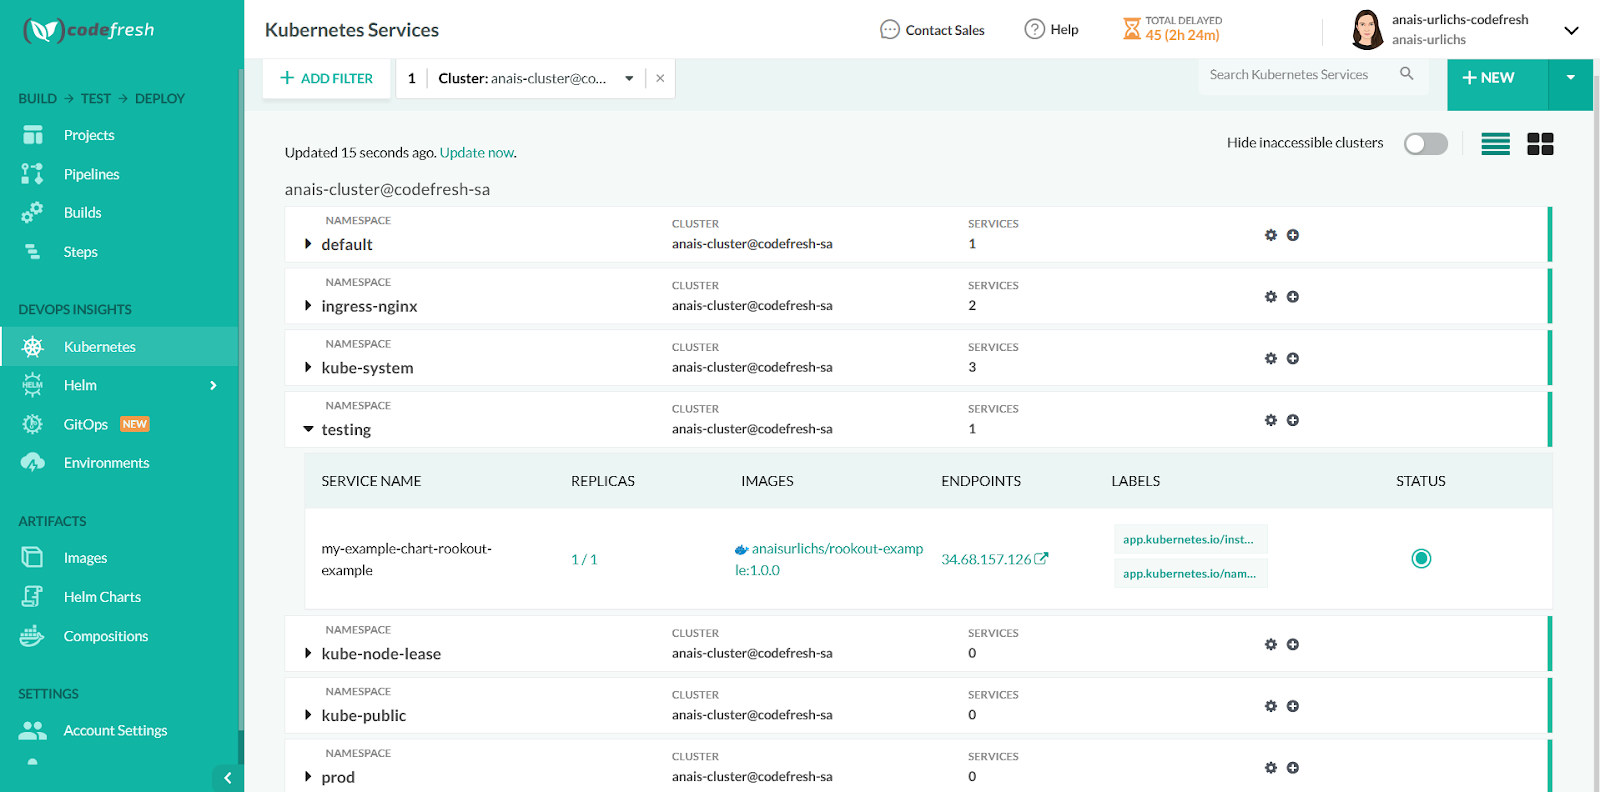
Kubernetes Dashboard in Codefresh
We can go ahead and open our running application. Our application is currently connected to our Rookout account. If anything does not behave as expected, we can go ahead and start debugging.
Configuring our Application to Use Rookout
By configuring the Rookout SDK within our application, we will have the ability to instantly collect data including local variables, stack traces, and tracing information from the running application in, on-demand whenever needed. This helps reduce the mean-time to repair defects within the application and improves the understandability of the code. It also allows developers to reproduce issues directly in the environment in which they occur (even in production) without having to create a separate reproduction environment where the chances of reproducing the bug are lower.
As described in the sections above, we’ve deployed the Rookout SDK within our sample application. If you open the app.py file and scroll to the bottom you can see we’ve added the following lines to our application:
import rook
rook.start()
This starts the Rookout SDK when the application runs. Rookout can be set up simply by installing the rook python package and then configuring the Rookout security token and labels as environment variables. For more details on the Rookout SDK setup, check out the SDK setup documentation.
Validating the Rookout Installation
After installing Rookout in the application and deploying with Codefresh, we’re ready to start debugging the application all while it’s running live in our Kubernetes cluster! Although this example uses Kubernetes, Rookout can debug applications deployed in any environment. After logging into our Rookout organization, we’re presented with a list of servers that are available to debug. In this case, we can see our Python example in the table:
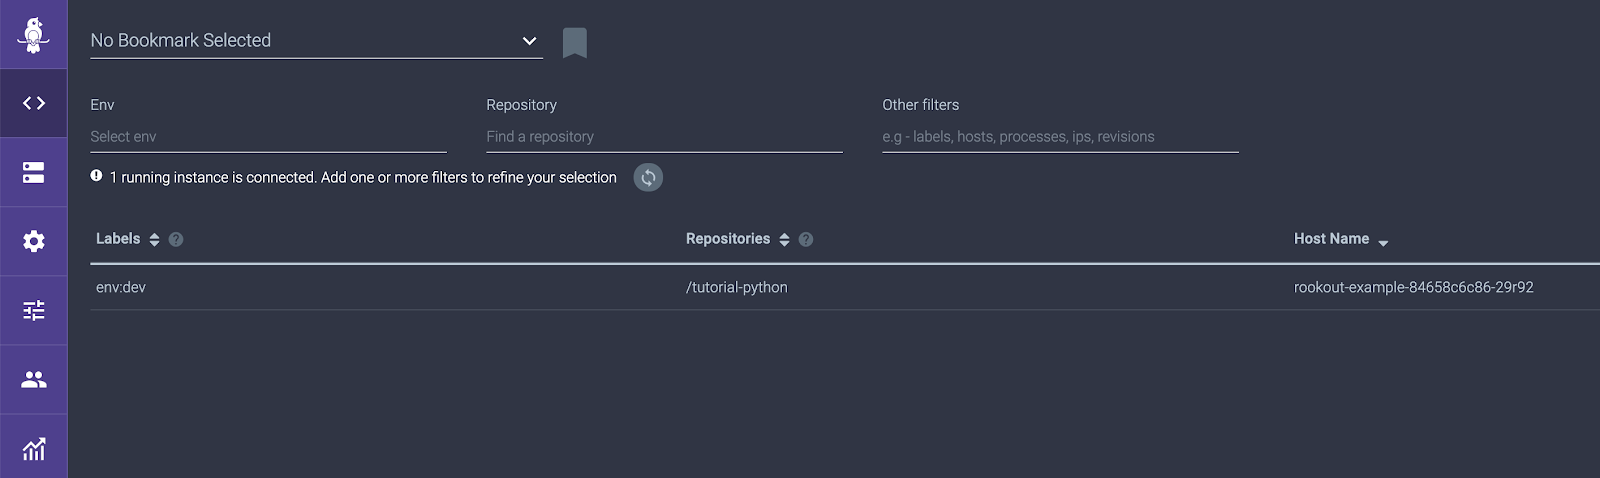
We can simply click on the row in the table to select it and click ‘Let’s Go’ to start debugging. If there were multiple servers or microservices that we wanted to debug, we could select more labels to ensure we’re able to get the exact data that we’re looking for.
Debugging Our Application
Once in the debugging view, we’re ready to connect to our source code repository so that we can begin setting data collection points in our code. To connect to your source code repository click on the “+” button and choose your repository type from the list.
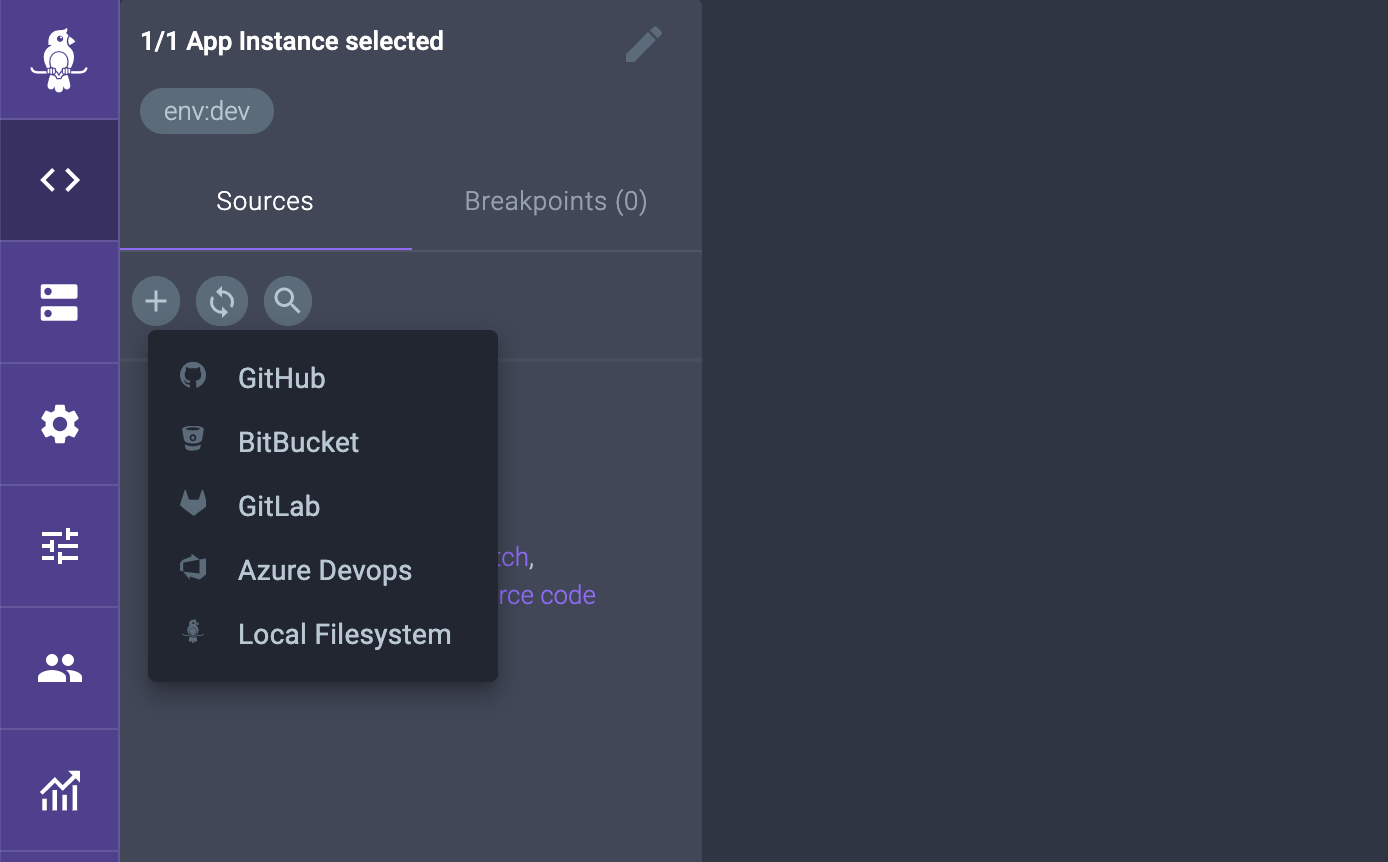
In this case, we’re using GitHub, so we’ll choose GitHub and follow the steps to authenticate and select our organization, repository, and branch/commit:
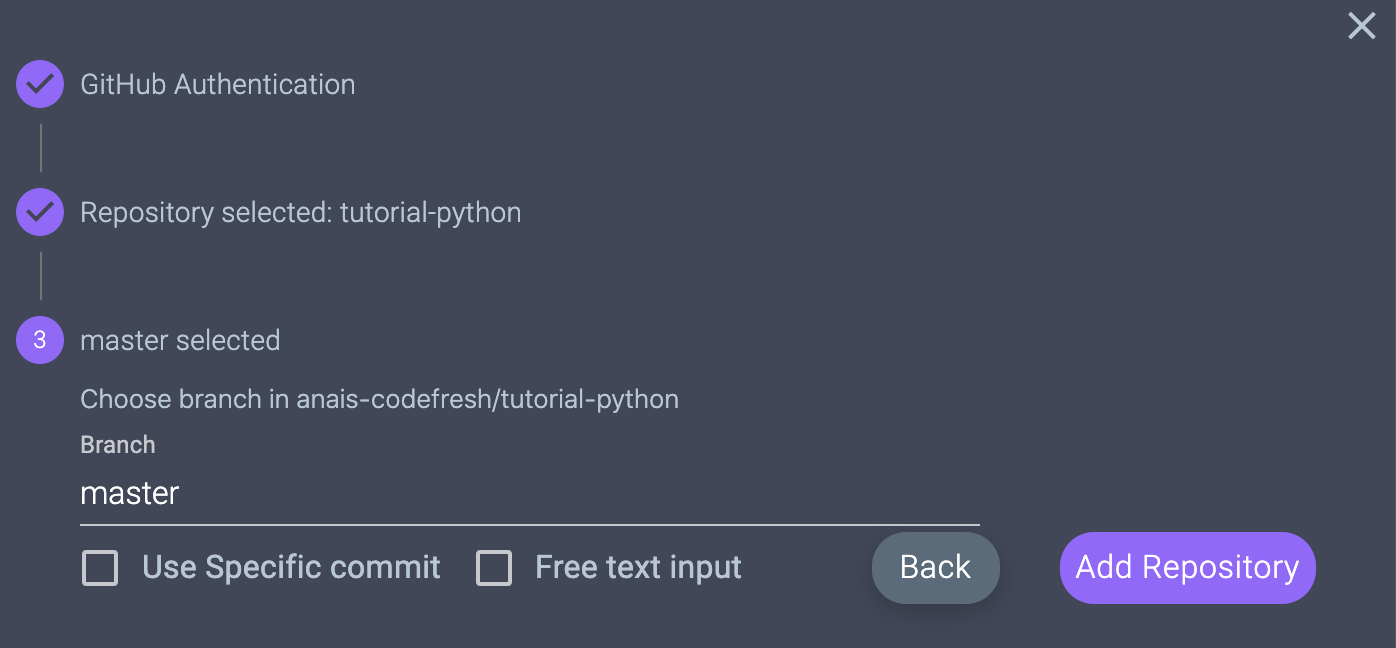
It’s important to note that Rookout never receives and is never able to view your source code. Connections to your repository are made directly from your browser to your repository via API calls. In addition, Rookout can be configured to automatically fetch your source code repository with the correctly deployed branch/commit to make things even easier.
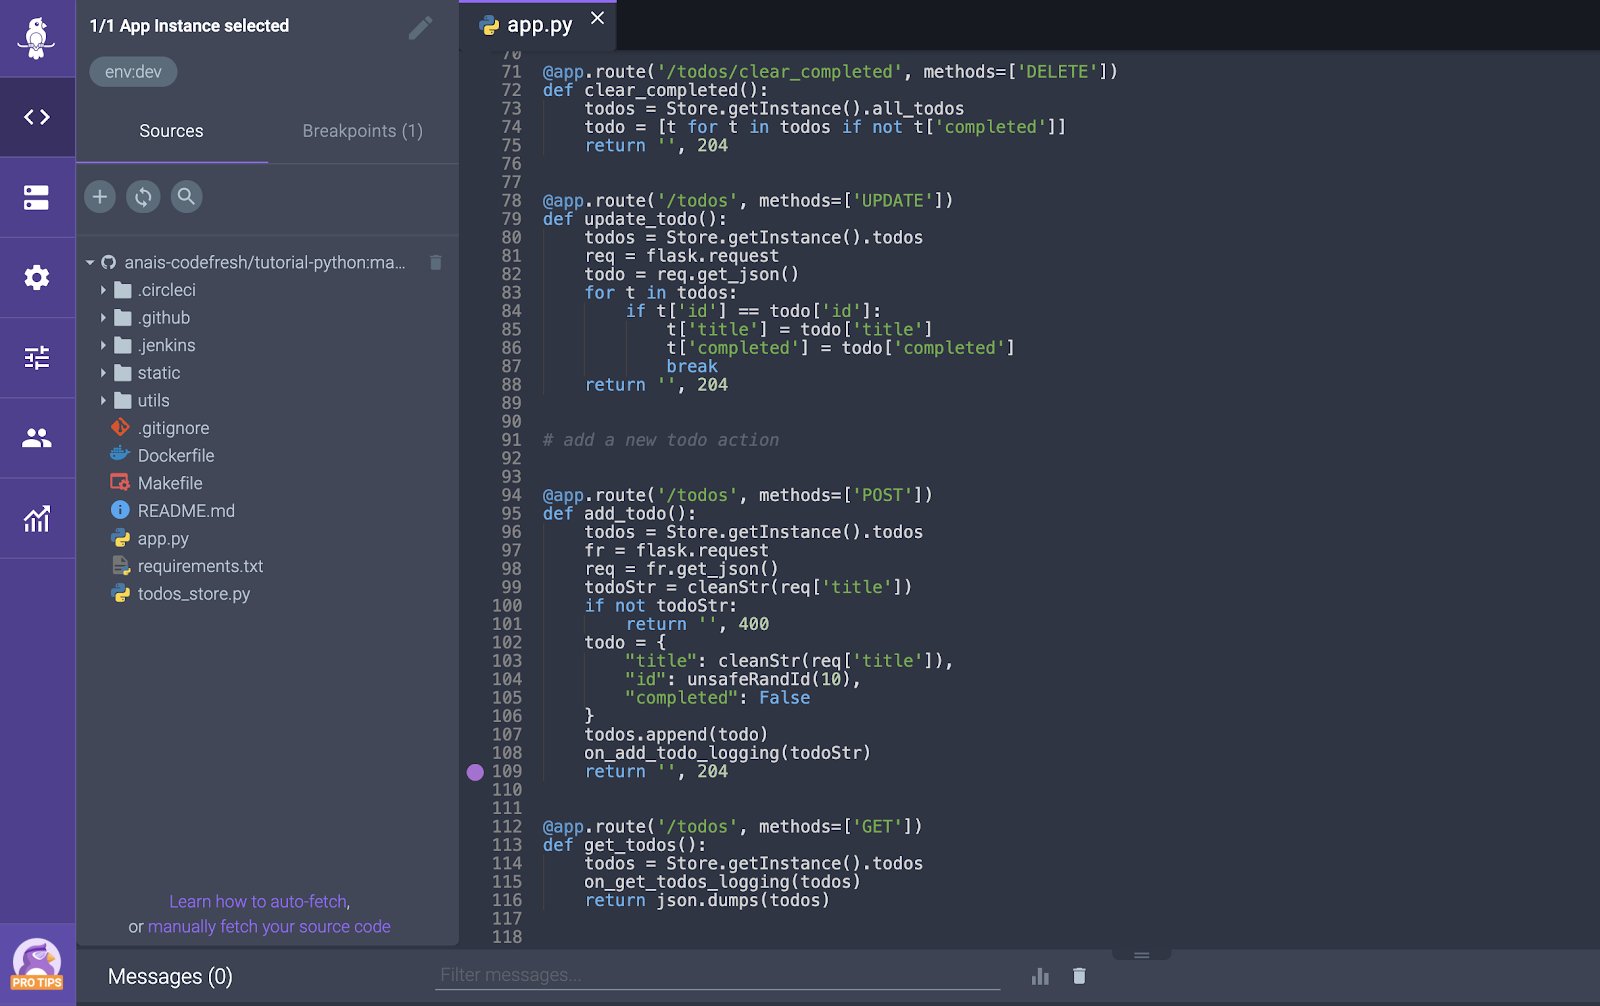
After connecting to the repository, we’re able to click on and open the app.py source code file and start setting data collection points which Rookout refers to as “Non-break breakpoints” to collect data directly from the running application. A non-breaking breakpoint is like a traditional breakpoint except that it doesn’t stop the application, require you to change code, or redeploy. You’ll probably notice the Rookout UI is very similar to an IDE. It’s built with IDE-like functionality to make developers feel at home as they’re using it debug, although it’s not a replacement for your current IDE.
In order to set a data collection point on a specific line of code, simply click in the gutter to the left of the line number as shown below:
In the screenshot above, we’ve set a non-breaking breakpoint on line 109 of the application in the add_todo function. Now anytime we add a todo item to the list, the add_todo function will execute and we will collect a snapshot of data from the application.
To debug any potential application issues, we can go to our application and add an item to the todo list:
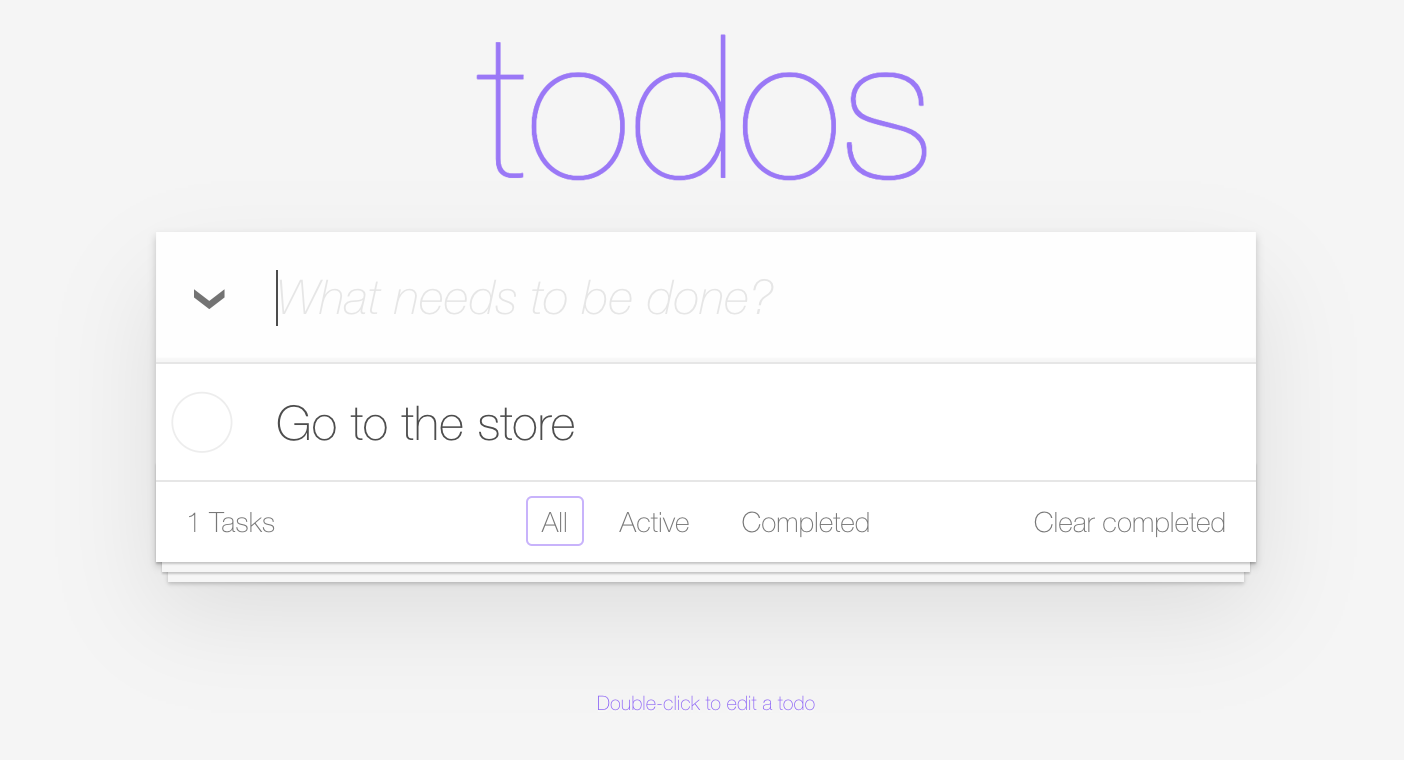
And then navigate back to Rookout to see the collected data:
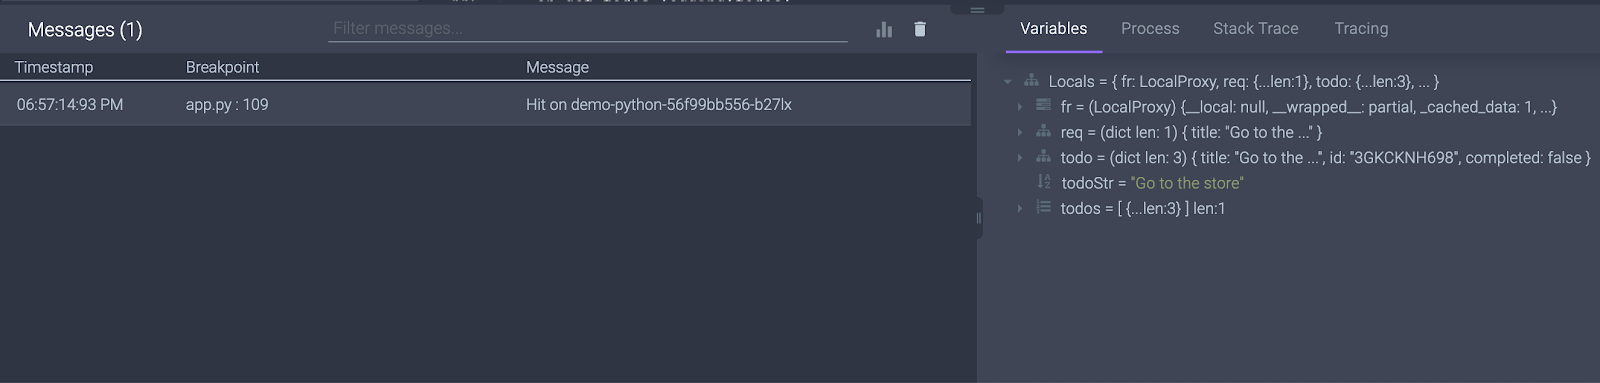
Rookout collects the following information:
- All of the local variables and their values
- Server and process-related information including profiling information if enabled
- A full stack trace which allows you to also debug code up the stack including 3rd party code
- Tracing information from applications using OpenTracing APIs so that you can correlate this transaction back to a specific trace context
With this information, Rookout allows you to debug potential code or performance-related issues in your prod or pre-prod environments all without stopping your application.
Looking forward
When disasters happen, and they most assuredly do at one time or another, it’s critical that you have the proper tools and processes in place to mitigate them as quickly and efficiently as possible. Automating build and deployment workflows allow code fixes to make their way into production without the inherent risk that is present in manual release processes. This allows developers to focus on what’s important: getting to the bottom of the issue and solving it fast. Having a remote debugging solution in place further allows teams to optimize their workflow and understand what’s happening in their running code in as short of a span as possible.
At the end of the day, it’s all about giving your customers a positive experience when using your product. The quicker you can remediate disasters, the quicker your customers will be thanking you for an amazing experience!
Want to see it all in action? Watch the webinar now!