Today we’re announcing the first-ever solution for live debugging a CI/CD pipeline. You can now place stop/resume breakpoints and inspect live pipelines in the same way that developers debug their applications. It’s the easiest, fastest way to troubleshoot and fix bugs in complex pipelines.
Live debugging is very well known to software developers and is one of the most efficient ways to find and fix bugs in application code. This technique goes hand-in-hand with graphical integrations from an Integrated Development Environment:
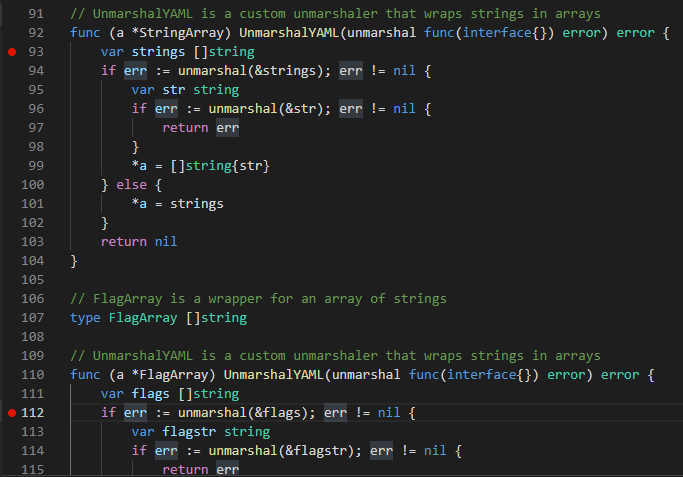
A developer can place breakpoints (the red dots) on the source code, and after running the application, execution will pause at the breakpoints. At this phase the state of the application (e.g. variables and call stack) can be examined to verify the correct working of the source code.
With our latest update, you now have the same amount of power and flexibility when creating a CI/CD pipeline.
Place breakpoints in your pipelines
With Codefresh you can already run your pipelines locally and see them executing on your workstation. This helps a lot when it comes to monitoring a pipeline and allows you to run the pipeline in a fully controlled context (your laptop).
As more customers are adopting Codefresh we wanted to help them debug their pipelines in a more user-friendly manner. While most CI solutions offer just a simple SSH connection to the builder node, we wanted to take pipeline debugging to the next level and allow you to debug your Codefresh pipelines in the same manner that you debug an application: with breakpoints.
When debugging an application, you place breakpoints in one or more positions in the source code, run the application in debug mode and inspect its state when it hits any of the breakpoints.
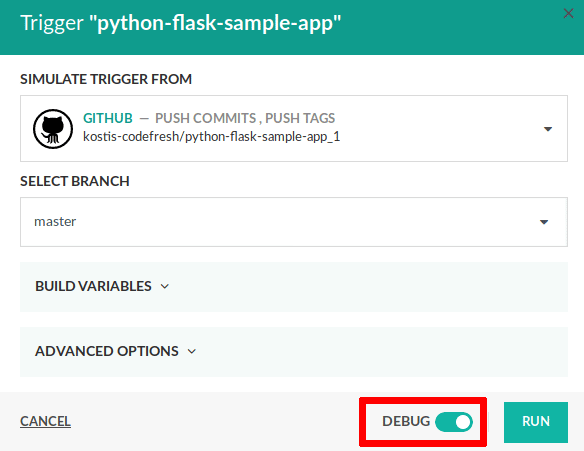
You can now do the same thing with Codefresh pipelines! First, you need to start a pipeline in debug mode using the toggle switch in the Run dialog:
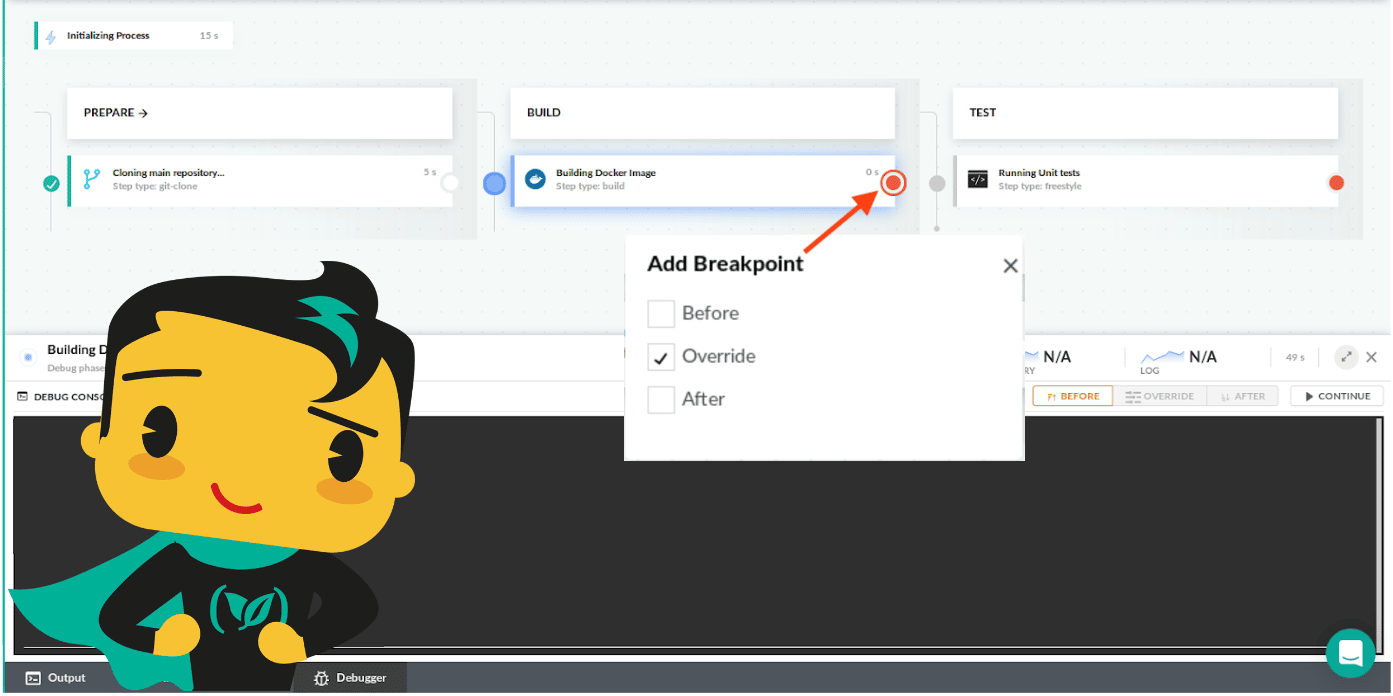
Now your pipeline runs in debug mode and you place a breakpoint in any pipeline step by clicking on the circle icon at the far right of the step item.
The pipeline will now stop every time a breakpoint is encountered. When this happens a new “debug” subwindow will become available with a fully interactive command-line shell.
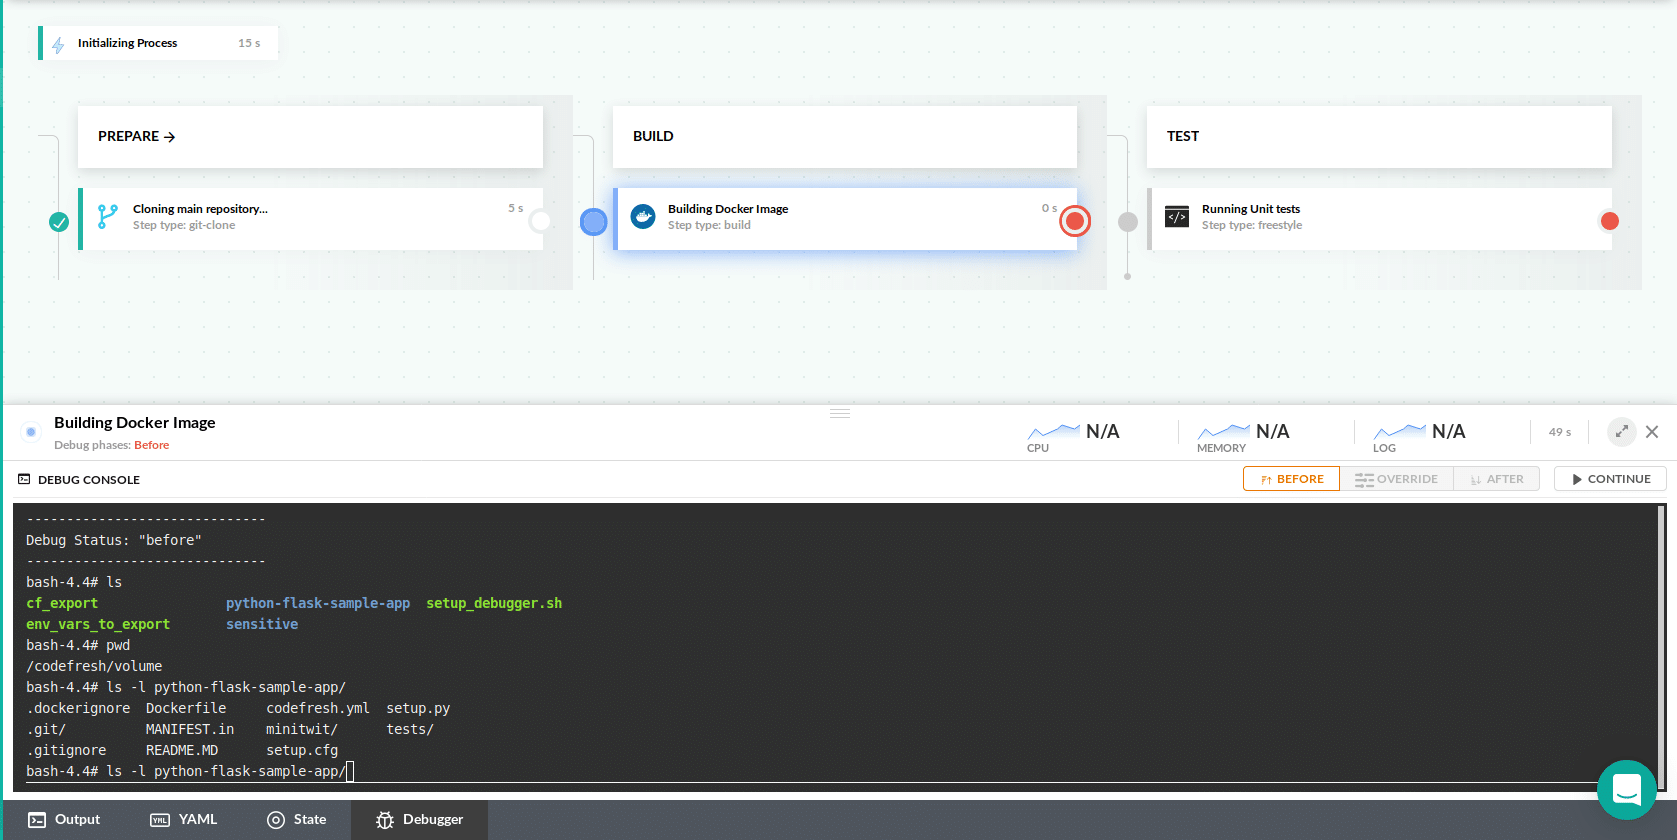
In the shell, you can write any unix commands that you already know as such cat, printenv, cd, etc. to see the state of your pipeline.
You can now ensure that:
- Code is checked out in the folder you expect it (even more so when you checkout multiple source git repositories).
- Secrets and configuration variables are available to the pipeline with their proper values.
- Custom environment variables you create with cf_export are visible in the needed pipeline steps.
- Intermediate artifacts (such as test results or coverage reports) are created correctly.
- Deployment settings (such as kubeconfig) are set up correctly, and so-on.
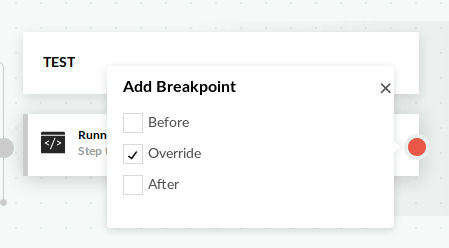
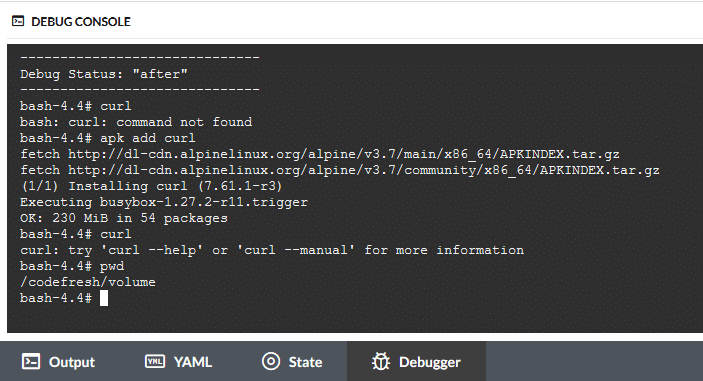
Once you are done click the “Continue” button and the pipeline will resume its operation. You can place breakpoints in any of the pipeline steps in 3 modes:
- Before the step has even started
- After the step has finished
- (For freestyle steps) override the commands mentioned in the pipeline definition and allow the user to run any commands in the debug window
This means that you are free to do anything in the debug window such as looking at your source code but also running your tests manually, downloading extra data, checking connectivity with external services, and so on.
For more details see the documentation page. We are very excited to make debugging pipelines as easy as possible and we believe that this new feature will lower the barrier even further for your CI/CD journey.
If you are an existing Codefresh user, contact us so that we can enable debugging in your account.
Ready to try Codefresh and start creating your own CI/CD pipelines for microservices? Create Your Free Account Today!