At Codefresh, we are fortunate to hear from customers of all sizes and in nearly every industry. A common interest is visibility into deployments and their respective environments. As a company filled with software enthusiasts and developers, this strongly resonates with our culture and our passion for empowering developers.
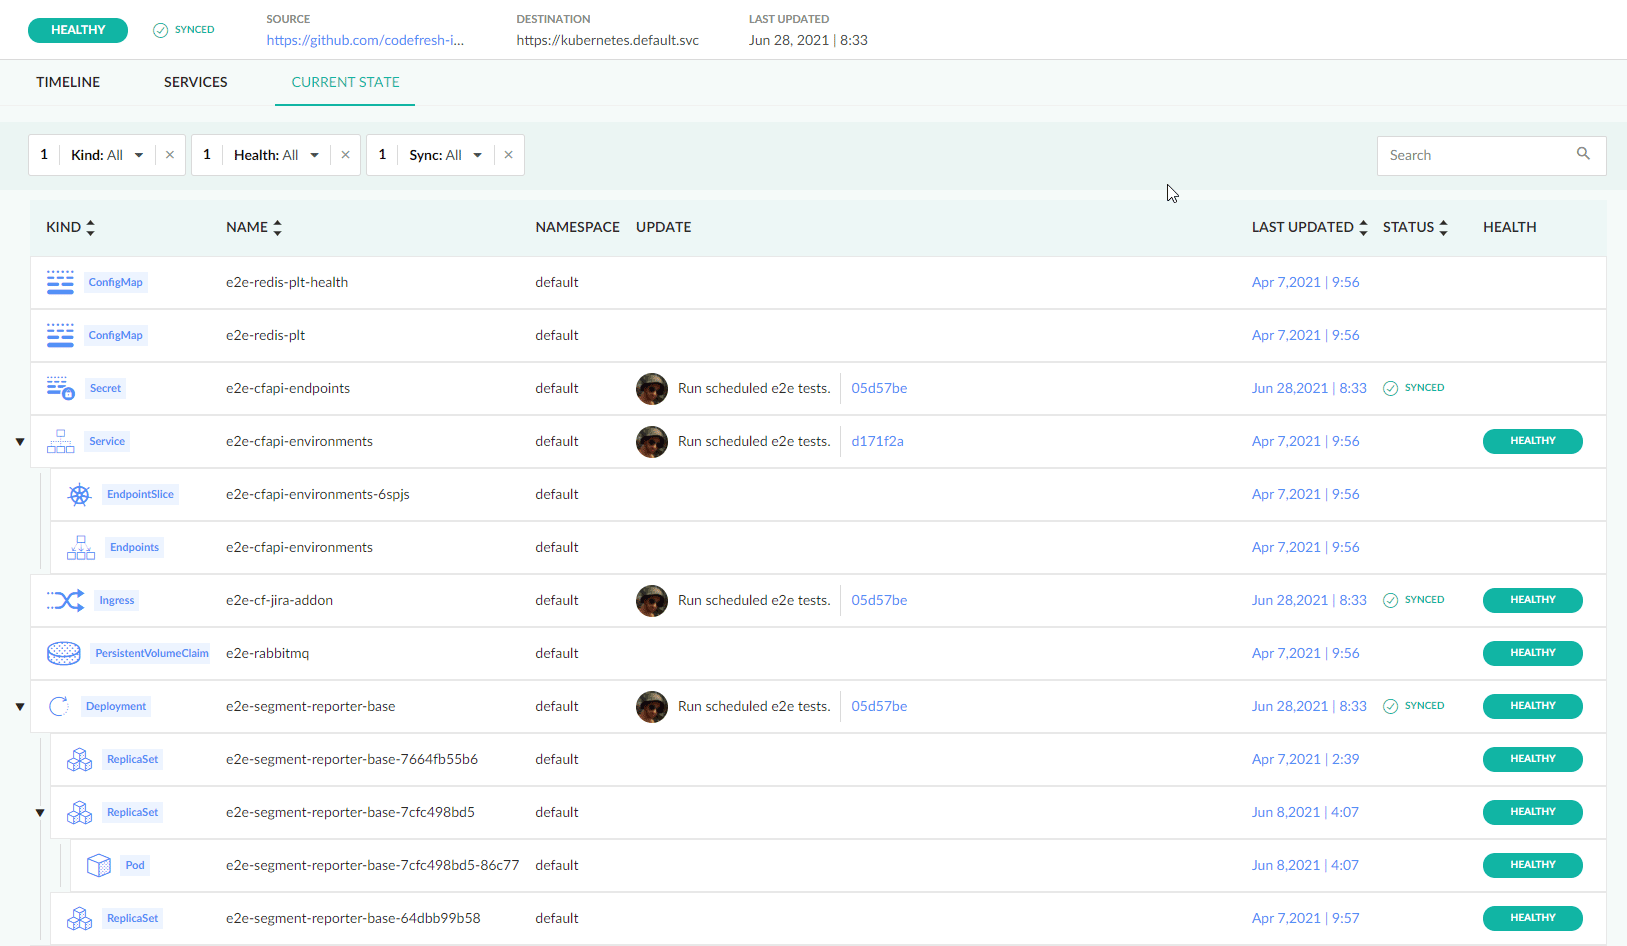
Visibility has been an area of continuous improvement for Codefresh and something we are committed to being the best at. We currently have comprehensive dashboards for Kubernetes, Helm, and your personalized environments. With our latest GitOps feature, we have introduced an exciting GitOps dashboard view with the current state of a deployment and its dependencies.

As you can see, this new dashboard is tightly integrated with our GitOps deployments. Let’s review a few reasons why Codefresh is so passionate about visibility into deployments.
Developers
Development teams are often made up of unique contributors with specialized expertise and a variety of skill levels. You may have a rockstar Node developer who could tell you the exact line of code where any feature is implemented but they are not comfortable with Kubernetes. We also frequently encounter highly technical teams in R&D divisions that are paired with less technical teams that still commit code.
Having a friendly interface can lower the barrier of entry to understanding the current state of an environment. You can easily get a comprehensive understanding of the deployment’s Kubernetes components without being a kubectl expert. Trust me, we understand many of you out there are kubectl wizards and this still benefits you. You can now spend less time assisting others who are not as proficient as yourself at kubectl and focus on your deliverables – now grab your wizard hat and get to work!
Security
Many companies live by the principle of least privilege. While this is certainly a good thing, it does mean that a user will only have privileges that are essential to perform their daily job. This typically means reduced capabilities in production and production-like environments such as staging and training. If your company requires security standards like PCI, ISO, SOC, or similar levels of compliance, these access rights will be flagged by a security audit.
This can considerably reduce your ability to view an environment. Limited visibility into a deployment can make troubleshooting deployment and production problems far more difficult. You typically have access to logs that you can work to correlate together, but a quick visual assessment can often reveal valuable information. For example, it could help you quickly identify that an expected replica set, endpoint, or secret are missing from the environment.
In an ideal world, production incidents never happen. We all know that this unfortunately doesn’t align with reality, and an expedient response to production issues is of the utmost importance.
Configuration Drift
One of the core components of GitOps is that every action is backed by declarative configuration. With declarative configuration and appropriate tooling to back it up, you can easily determine if you have configuration drift and that the state of your environment is different than the intended end state.
I imagine many of you reading this have experienced an incident caused by a backdoor production change that you were not aware of. Having the ability to quickly assess if your deployment is in sync and without configuration drift can quickly move your analysis to other areas.
Current State Dashboard
Now that we have a solid understanding of how this can empower your development teams, it’s time to dig in. You can learn more about this from our documentation or this nifty feature highlight video
