One of the central ideas behind the Codefresh GUI is giving as much information as possible to both developers and operators regarding the status of a deployment. Just because a pipeline has finished successfully does not always mean that the respective environment is healthy.
Today we are releasing an environment dashboard for both Helm and plain Kubernetes releases, which unlike other environment dashboards you might be familiar with, actually shows real-time cluster information in addition to build status.
This new environment dashboard has 3 distinctive characteristics:
- It is for both Helm and non-Helm deployments.
- It bridges the gap between clusters and builds that affect them by combining information on both cluster status and pipeline status.
- It can work for both static and dynamic environments.
Let’s see these points in turn.
Using a single dashboard for both Helm and plain Kubernetes deployments
This is probably one of the most important advantages of the new Environment Dashboard. It works for both Helm releases as well as simple Kubernetes deployments. This allows you to mix and match release types on the same dashboard getting a single overview of all your applications regardless of source.
At Codefresh, we use Helm as the defacto package manager for Kubernetes. With the release of Helm 3 (and the removal of the server-side component called Tiller), we see an increased interest in Helm from companies of all sizes. In fact, one of the first dashboards we added in Codefresh was the Helm promotion board.
We realized however that not all companies wanted a Helm-only dashboard. One of the most common feature requests we had is a generic environment board for plain Kubernetes deployments.
With this new dashboard, everybody should be happy. It doesn’t matter whether you have adopted Helm or not. You can still use a single environment board for all your needs.
We see a lot of companies that use Helm for existing applications they want to depend on (e.g. Vault, ELK, Kafka) but still employ a completely different deployment mechanism (e.g. Kustomize) for their own applications. The new dashboard can support both cases with ease.
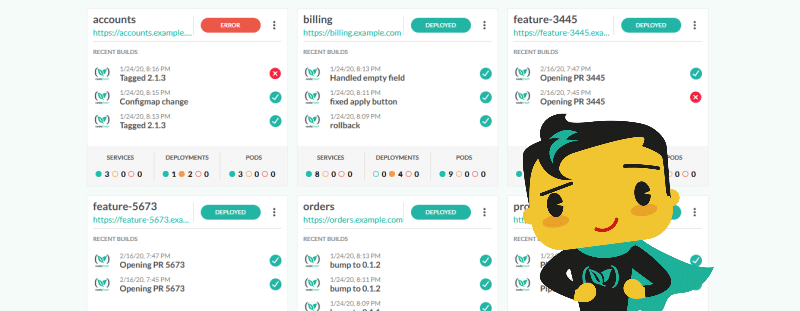
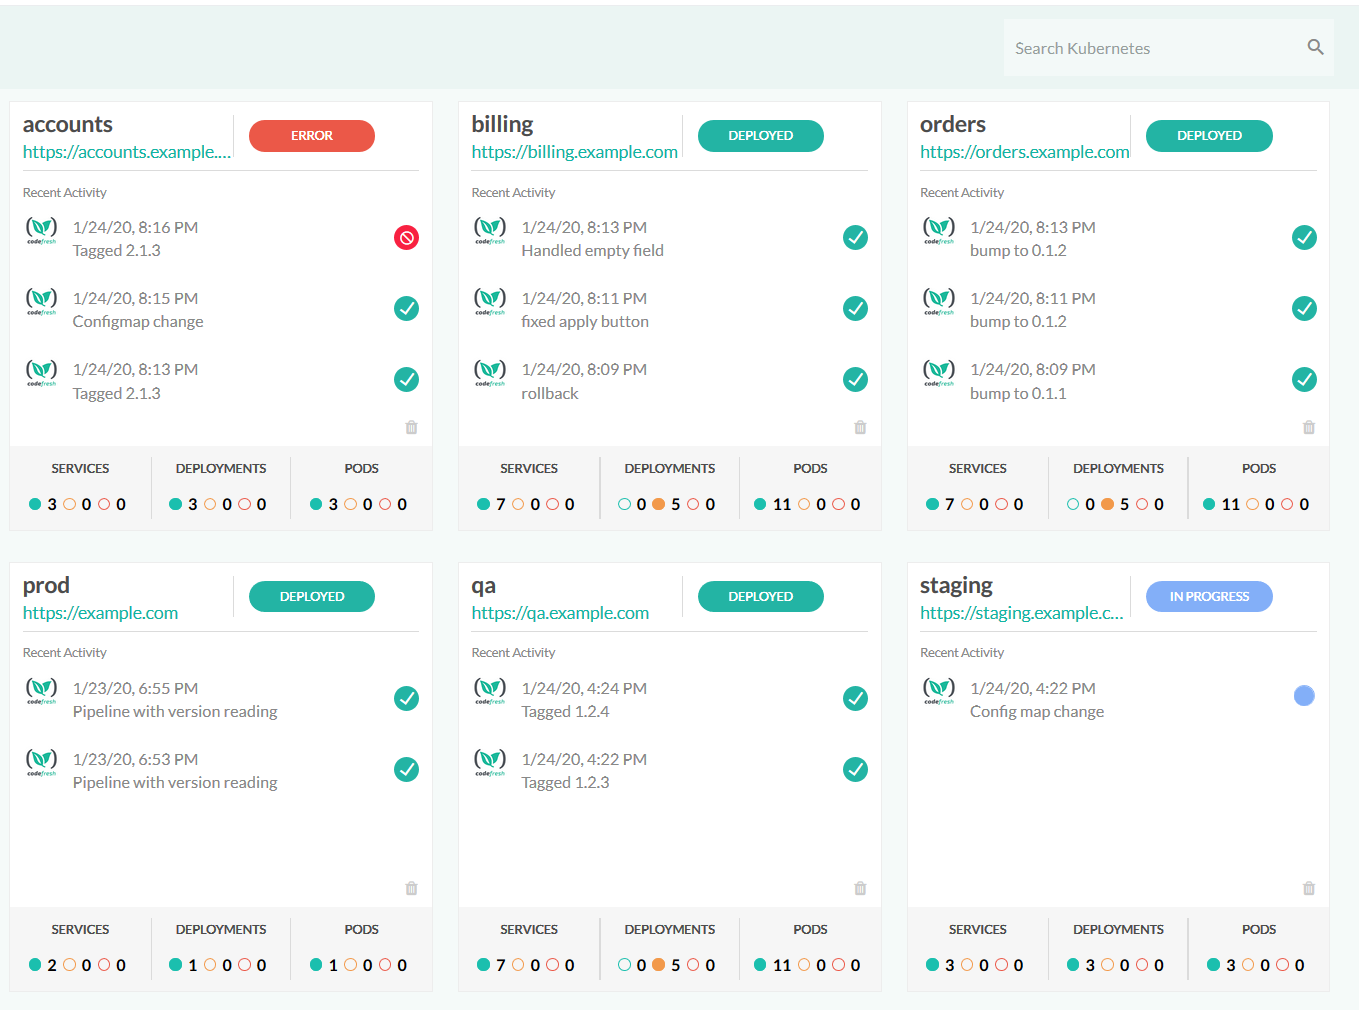
You can see Helm releases and plain Kubernetes deployments in the same manner:
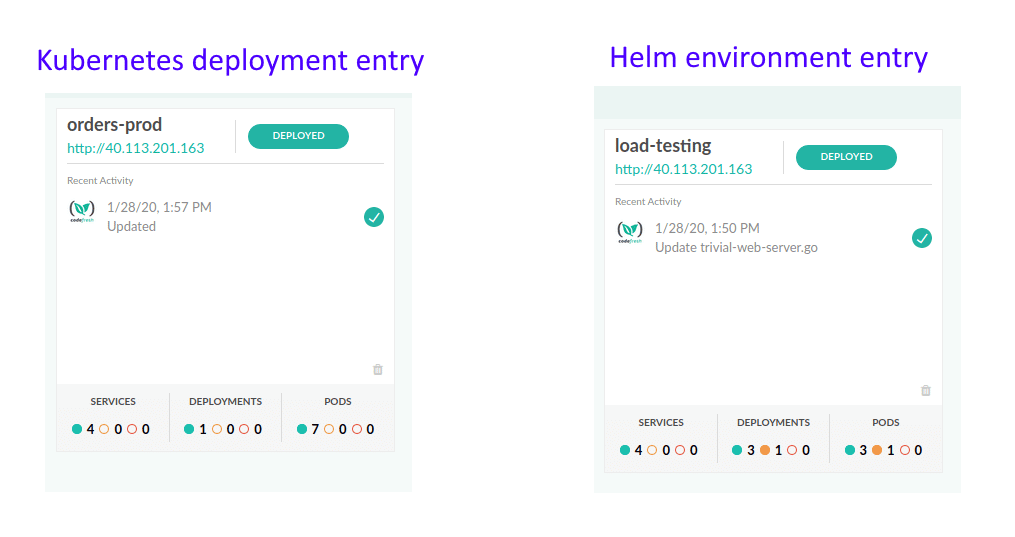
In both cases, the dashboard shows live data of the pod status for each application. For Helm releases you define the name of the release that you want to monitor and the cluster it belongs to. For a Kubernetes environment, you define the cluster and the namespace that contains the deployment.
Troubleshooting failed deployments
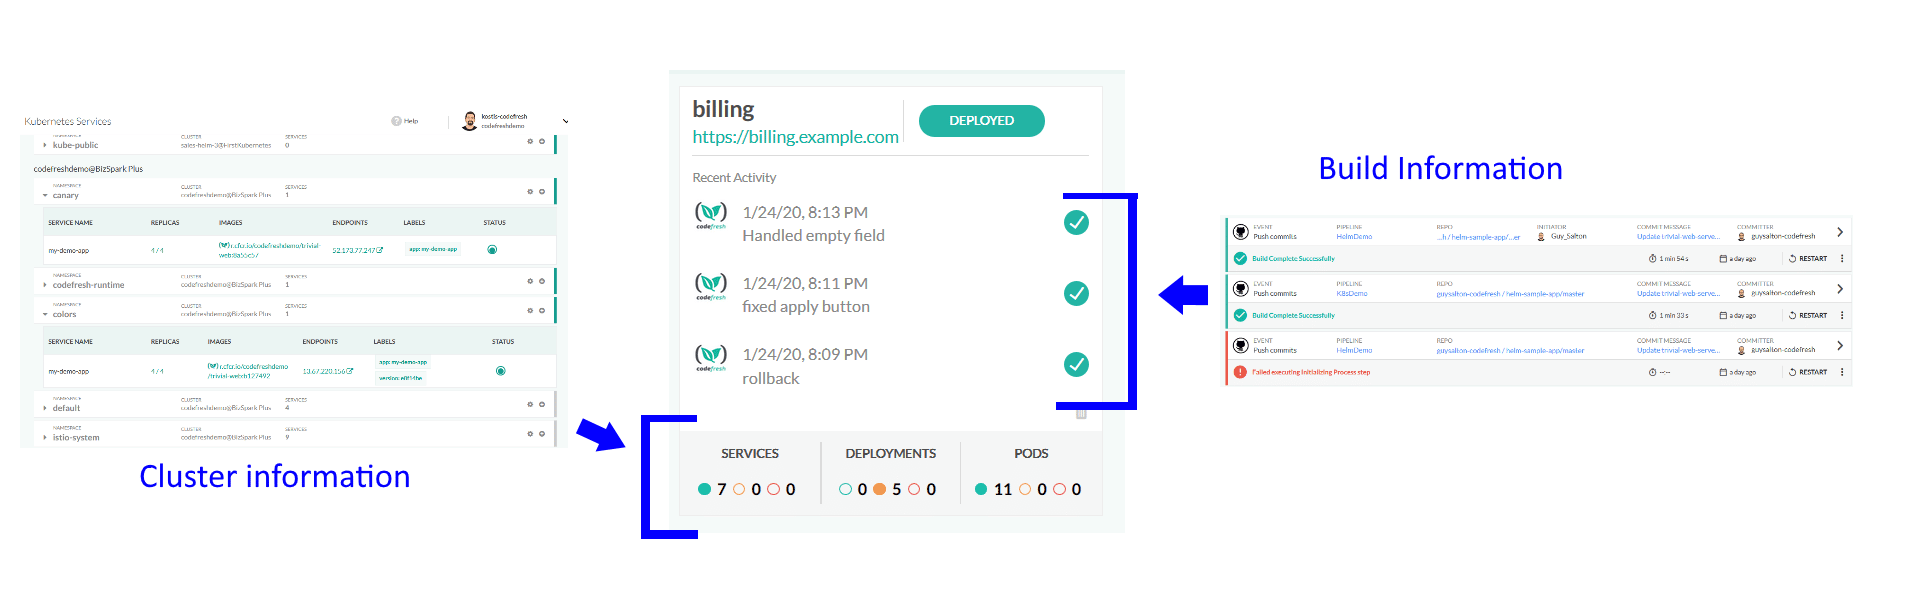
The second characteristic of the dashboard is that for each environment entry you also get a history of the builds that affected it in the same UI card.
The relationship between environments and pipelines is many-to-many. Unlike other environment dashboards that you may have seen already in other CI/CD solutions, in Codefresh a pipeline can affect many environments and a single environment can be affected by multiple pipelines.
The suggested way to use environments is to link ALL pipelines that affect it including application deployments, database changesets and configuration updates.
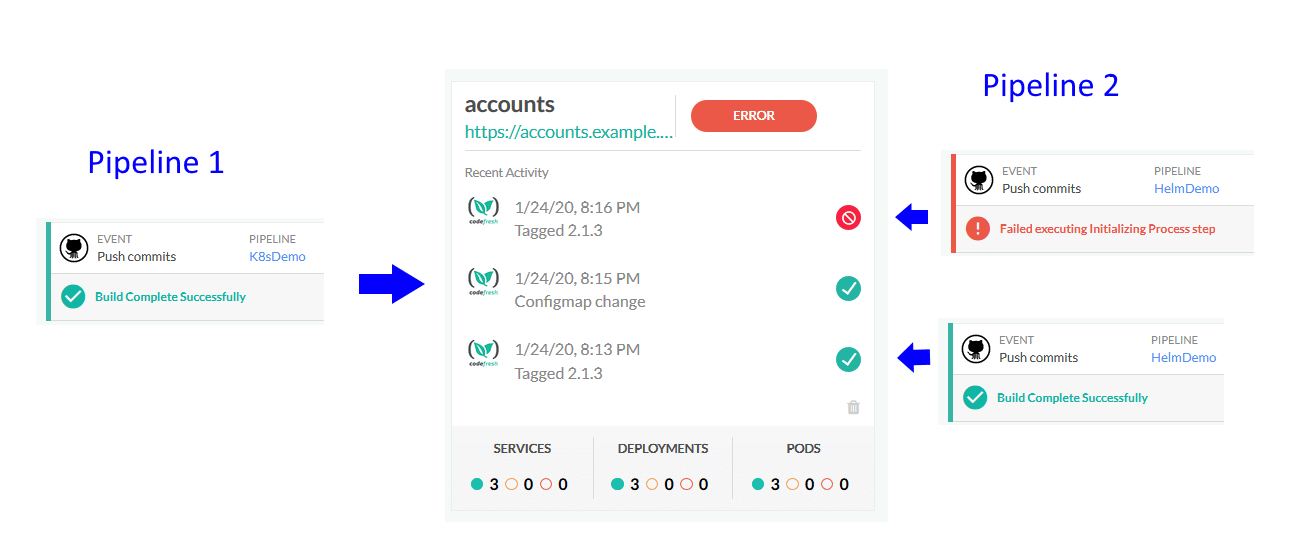
This makes the troubleshooting of deployments very easy, as you get a full history of everything that happened in the environments. In the example above we can see that an application deployment has failed (it used to work before), because another team performed another configuration change.
The configuration change itself was successful, but it broke the next application deployment. Scenarios like this usually involve lengthy detective work between teams, playing the “what happened in the last hours” guessing game.
With the new environments board all build history is transparent, so locating problematic changes is as effortless as possible.
Creating environments dynamically
You can create environments either from the GUI screen or programmatically from pipelines. Within a pipeline, you define the connection to an environment with the following syntax:
   env:
      name: load-testing
      endpoints:
      - name: Main
        url: http://40.113.201.163
      type: helm-release
      change: '${{CF_COMMIT_MESSAGE}}'
      filters:
      - cluster: my-demo-k8s-cluster
        releaseName: my-go-chart-prod
Notice however, that an environment defined in a pipeline will automatically appear in the dashboard (even if it wasn’t created with the GUI first). This means that you can use environment entries in pipelines that deal with dynamic test environments (usually but not always for pull requests).
The typical scenario is that a developer creates a Pull Request for a feature, a dynamic environment is launched and that environment appears at the dashboard.
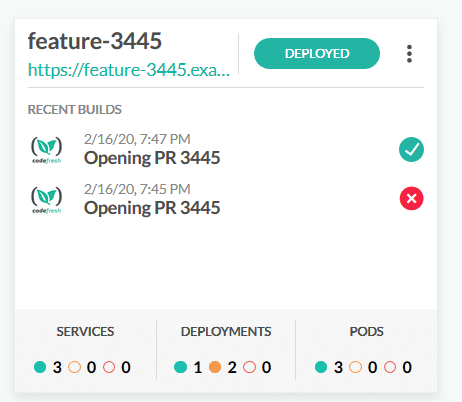
This way you can see an overview of all your pull requests or staging environments and what they mean for cluster status.
The environments dashboard is now available to all Pro-level accounts and above, and we welcome any feedback you have regarding their functionality.
New to Codefresh? Create Your Free Account Today!