Modern CI/CD pipelines are no longer just about whether builds succeed, they’re about how fast, how efficiently, and at what cost they run.
One theme has come up consistently in customer conversations:
“My builds are slow, expensive, and I don’t know where to start fixing that.”
Pipeline Performance Profiling is designed to close this gap by making pipeline behavior observable, measurable, and explainable. Instead of treating build time as a single opaque number, it breaks pipeline execution down into clear phases, steps, and resource signals. Built on OpenTelemetry and Prometheus-compatible, it exposes these insights using open, industry-standard metrics, giving teams the flexibility to analyze pipeline cost and performance with the same monitoring tools they already use. This allows teams to understand where time and resources are spent, why bottlenecks occur, and how to make informed trade-offs between speed, cost, and reliability.
Why We Built Pipeline Performance Profiling
Our customers asked us clear, practical questions:
- How do I choose the right machine sizes for my builds without wasting money?
- Where exactly are my pipeline bottlenecks?
- Why do some steps feel slow even when nothing has changed?
- How much time are we losing pulling images instead of executing code?
- Can I analyze Codefresh builds with the same monitoring tools I already use?
Until now, answering these questions required guesswork, manual timing, or support escalations with limited data.
Pipeline Performance Profiling changes that by instrumenting the pipeline runtime itself and exposing step-level time and resource metrics in a way that’s easy to analyze, trend, and correlate.
What Is Pipeline Performance Profiling?
Pipeline Performance Profiling is the first phase of Codefresh’s broader Pipeline Observability initiative.
It provides:
- Step-level execution timing (active vs. idle)
- Initialization vs. execution breakdown
- CPU and memory metrics
- Cache usage visibility
- Prometheus-compatible metrics, visualized through Grafana dashboards
- OpenTelemetry-native instrumentation, so your data fits into existing observability pipelines
This foundation supports developers, DevOps engineers, and platform teams who need evidence-based answers, not assumptions.
Performance: Find Time Sinks and Bottlenecks
One of the hardest performance problems to solve is unexplained slowdown. Builds still succeed, configurations haven’t changed, yet pipelines take longer to complete, leaving teams guessing where the time is going.
“Our builds feel slower, but nothing obvious changed.”
With Pipeline Performance Profiling, teams no longer have to rely on intuition or one-off comparisons. By breaking pipeline execution into measurable phases and steps, the dashboards make it clear where time is actually spent and how that changes over time.
With this visibility, teams can answer questions such as:
Build and Step Duration Trends
Understanding whether performance is improving or regressing requires looking beyond individual builds.
- How does build duration change over time?
- Are pipelines getting faster, or are there gradual regressions?
- Which steps consistently dominate execution time across builds?
These trends help teams spot slowdowns early and focus optimization efforts where they will have the biggest impact.
Initialization Time: Understanding Build Preparation Delays
Many pipeline slowdowns happen before any build step runs. The initialization phase includes several setup stages that can often be optimized to speed things up. Pipeline Performance Profiling makes these stages visible through build preparation duration metrics (such as P95 trends), helping teams quickly see when and why startup time increases.
Common contributors include:
- Request account clusters: Attaching many clusters can slow build startup as each one is contacted. Limiting pipelines to only the required clusters can significantly reduce initialization time.
- Validate Docker daemon: Slow validation often indicates delays in provisioning Docker-in-Docker pods, which depend on cluster configuration and capacity.
- Start composition services: Pipelines with many Docker Compose services may start more slowly due to image pulls and container startup.
By identifying which part of initialization is responsible for delays, teams can make targeted configuration changes and reduce overall pipeline startup time.
Cost: Optimize Resource Usage Without Guesswork
Slow pipelines are frustrating, but expensive pipelines are even worse. Too often, CI/CD resource decisions are made conservatively, teams over-provision CPU and memory to avoid failures, without clear visibility into whether those resources are truly needed. Pipeline Performance Profiling addresses this by exposing how resources are actually consumed over time, enabling teams to use historical data instead of assumptions to make deliberate, data-driven decisions about sizing and efficiency.
Pipeline Performance Profiling helps teams answer questions such as:
Resource Utilization per Pipeline and Step
- What is the average and peak CPU usage per pipeline and per step?
- How much memory is actually consumed during builds?
- Are there steps that briefly spike resource usage while the rest of the build remains under-utilized?
Right-Sizing and Cost Optimization
- Which pipelines are consistently under-utilizing allocated resources?
- Where are CPU or memory requests clearly higher than necessary?
- Can pod sizes or machine types be safely reduced without impacting build stability?
With this visibility, right-sizing becomes a controlled, low-risk process rather than a guessing game. Teams can adjust resource allocations confidently, validate changes over time, and reduce CI infrastructure costs without sacrificing performance or developer productivity.
Cache Utilization: Stop Paying for Repeated Work
Repeated image pulls and dependency downloads are a quiet but persistent drain on pipeline performance. When caching is ineffective or inconsistently used, teams end up paying the cost on every build, longer startup times, wasted network bandwidth, and slower feedback loops for developers.
Pipeline Performance Profiling makes cache behavior visible, so teams can understand whether caching is actually helping and where it falls short. Instead of guessing, they can see the real impact cache usage has on build duration and step execution.
With this visibility, teams can answer questions such as:
- How often are cache volumes reused across builds?
- How does overall build time differ when a cache volume is reused versus not reused?
- How does step duration change when cache hits occur?
This makes it easier to identify pipelines that rarely benefit from caching, steps that could be restructured to improve reuse, and opportunities to reconfigure cache volume usage to improve hit rates, all while reducing build startup time. Even modest improvements in cache utilization can translate into noticeable gains in speed and efficiency at scale.
Bring Your Own Observability Stack
A core design goal for Pipeline Performance Profiling was avoiding lock-in to proprietary tooling such as Datadog. The metrics it exposes are fully compatible with OpenTelemetry and Prometheus and visualized through Grafana, making pipeline performance a first-class part of your existing observability ecosystem rather than a separate, siloed view.
This approach allows teams to:
- Analyze Codefresh pipeline metrics alongside application and infrastructure data
- Correlate slow pipeline steps with cluster-level CPU or memory pressure
- Feed build performance data into existing dashboards, alerts, and cost-analysis workflows
For hybrid and on-prem environments in particular, this brings first-class pipeline observability using tools teams already trust, without requiring new platforms or specialized integrations.
Grafana Dashboards
Metrics are only useful if teams can easily explore, understand, and act on them. To make Pipeline Performance Profiling immediately practical, Codefresh provides ready-to-use Grafana dashboards that turn raw pipeline metrics into clear, actionable insights, helping teams move quickly from “something feels slow” to “here’s where the problem is.”
To help teams get immediate value, Codefresh provides two ready-to-use Grafana dashboards.
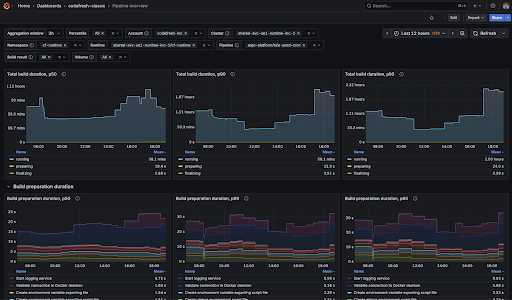
1. Pipeline Overview
The Pipeline Overview dashboard is designed to help teams understand how their pipelines behave over time, rather than focusing on a single build in isolation. It provides a high-level view of performance trends, making it easier to spot gradual slowdowns, sudden regressions, or improvements introduced by recent changes.
Using this dashboard, teams can answer questions such as:
- How is build duration changing over time?
- What is causing delays during build initialization?
- Are resources allocated effectively for this pipeline?
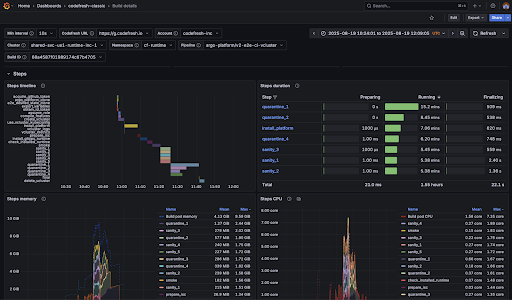
2. Build Details
While the Pipeline Overview focuses on trends, the Build Details dashboard zooms in on individual builds to support faster troubleshooting and optimization. It is designed for moments when something looks off and teams need to understand exactly what happened during a specific execution.
With this level of detail, teams can answer questions such as:
- Which step consumes the most time or resources?
- Can the step structure be redesigned for faster execution?
- What caused delays during build bootstrap or startup?
Together, these dashboards provide both the big picture and the fine-grained detail needed to move from detection to diagnosis. Teams can track long-term performance trends, investigate anomalies when they occur, and make informed changes with confidence.
We also encourage teams to extend these dashboards with additional graphs and views tailored to their specific workflows and business goals. As you customize and optimize your dashboards, we’d love to hear about your experience, your feedback helps us continue improving Pipeline Performance Profiling for you and for other customers as well.
What’s Next
Pipeline Performance Profiling is an important first step, and we’re actively iterating on it based on real-world usage and customer feedback. We’re already working closely with early customers, using real builds and environments to validate metrics, dashboards, and workflows — and the feedback so far has been invaluable.
Over the coming months, we’ll continue evolving this capability with a focus on deeper insights and improved usability. Key areas of investment include:
- Expanded support for SaaS customers: enabling environments where Codefresh hosts both the control plane and runtime to benefit from the same metrics and to analyze them with existing observability tools.
- Richer Grafana dashboards: making it easier to spot regressions, identify anomalous builds, and understand performance patterns.
- Foundations for performance management: laying the groundwork for future capabilities such as actionable insights, smarter analysis, and performance regression detection.
As always, this work is driven by real customer needs. We encourage you to start exploring Pipeline Performance Profiling with your own pipelines, extend the dashboards to match your workflows, and let the data guide your optimization efforts. Your usage and feedback help shape what comes next and allow us to continue improving the experience for all Codefresh customers.