The Docker infrastructure abstracts a lot of aspects of the creation of images and running them as containers, which we usually do not know about nor interact with. One of those aspects is the handling of the filesystem inside the container.
This post is a case study on how we discovered that writing large amounts of data inside a container has side effects with memory caching. Initially, we thought that we had an issue with our source code, but this was never the case.
In this post, we will see:
- A walkthrough on how you can reproduce the memory issue that we encountered
- How we discovered a temporary workaround
- The steps we followed to find a proper solution
If you want to know more about the way Docker abstraction behaves and you always had unexplained questions about large memory usage, then this post is for you.
How Docker Handles Memory Allocation
Before we dive into our specific scenario, we want to give an overview of how memory allocation and usage works in Docker.
Docker does not apply memory limitations to containers by default. The Host’s Kernel Scheduler determines the capacity provided to the Docker memory. This means that in theory, it is possible for a Docker container to consume the entire host’s memory.
One way to control the memory used by Docker is by setting the runtime configuration flags of the ’docker run command’. There are specific scenarios when you will want to set these limitations.
Generally, you want to prevent the container from consuming too much of the host machine’s memory. In the case of Linux, once the Kernel detects that it will run out of memory, it will throw an ’Out Of Memory Exception’ and will kill processes to free up memory.
Usually, those processes are ordered by priority, which is determined by the OOM (Out of Memory) killer. However, if the wrong process is killed, the entire system might crash.
Contrary to popular belief, even if you set a memory limit to your container, it does not automatically mean that the container will only consume the allocated memory. You can try this out yourself. The following example allocates 60mb of memory inside of a container with 50mb. You would expect the OOME to kill the process. However, it does not. To try it out, run:
docker run --memory 50m --rm -it progrium/stress --vm 1 --vm-bytes 62914560 --timeout 1s
To prevent this from happening, you have to define the memory-swap in addition to the memory by setting it equal to the memory:
docker run --memory 50m --memory-swap 50m --rm -it progrium/stress --vm 1 --vm-bytes 62914560 --timeout 1s
Note that this will only work if your Docker has cgroup memory and swap accounting enabled.
The official Docker documentation provides more details on the steps that you can take to restrict the container’s memory usage; here are the main points:
- Perform tests to understand the memory requirements of your application before placing it into production.
- Ensure that your application runs only on hosts with adequate resources.
- Limit the amount of memory your container can use, as described in the official Docker documentation.
- Be mindful when configuring swap on your Docker hosts. Swap is slower and less performant than memory but can provide a buffer against running out of system memory.
- Consider converting your container to a service, and using service-level constraints and node labels to ensure that the application runs only on hosts with enough memory.
More information can be found in the official Docker documentation for runtime options.
Observing a memory issue with our ETL script
This section provides an overview of our script and details how you can recreate the memory bloat using Codefresh and the YAML file provided.
The issue appeared when we ran an ETL (extract-transform-load) application inside a container.
The details of the business purpose behind the application are not that important. In short, this is the process that our application was supposed to follow:
- Pull quite a lot of open-source data into memory
- Convert the data and write it into a single file on the filesystem
- Next, upload the file to Google Cloud and populate it into BigQuery
The resulting file consists of about 20 million lines, so we expected the process to take some time.
However, we observed that after a while, we received a memory indication warning. The container then slowed down and finally crashed.
Reproducing the issue with Node.js
Just to confirm that our application code is not at fault here we reproduce the error with a simple script running in Node.js, image node:12.13.0 :
'use strict';
const fs = require('fs');
const sameFile =process.env.SAME_FILE;

//node --max-old-space-size=400 ./checkBloat.js
const main = async () => {
    let totalWrite = 0;
    let fileCnt = 0;
    let numFiles = 1;

    while(true) {
        const filename = sameFile ? ' file' : `file${numFiles}`;
        const theFile = fs.openSync(filename, 'w');
        for(let i=1; i<10000000+1;i++){ fileCnt=i; fs.writeSync(theFile, `${i}) =================================================================>${Math.random()}`);
            totalWrite+=1;
            if (totalWrite%100000===0) {
                console.log(`${filename} ${numFiles}) cnt: ${fileCnt})total written: ${totalWrite} `);
            }
        }
        console.log(`CLOSE FILE } `);
        fs.closeSync(theFile);
        numFiles++;
    };
};

Promise.resolve()
    .then( async () => {
            await main();
    });
This script reproduces the effect of the memory climbing up close to the limit of the underlying machine and staying there. This could continue until the device filesystem is full. Then, we would try to log into a Unix shell and flush the memory, in which case it would crash.
Reproducing the issue with a Python script
To compare with our Node.js script, we ran the same logic in Python. This would verify the fact that the application code is not a fault, but instead something is wrong with the container runtime.
We rewrote the NodeJs script in Python. The Python script would seem to work in the beginning but at some point, there was no more room to write the data to the output file and we would receive the following error message: OSError: [Errno 28] No space left on device
import os
import sys
from collections import defaultdict
lines = 0
file_cnt = 0

d=defaultdict(list)
for k, v in ((k.lstrip('-'), v) for k,v in (a.split('=') for a in sys.argv[1:])):
     d[k].append(v)
print (d)
limit = int(d.get('limit')[0]) if  d.get('limit')  else None
same_file =  False if not d.get('bloat') or d.get('bloat')[0] in ['true', 'on'] else True
stats =  True if not d.get('stats') or d.get('stats')[0] in ['true', 'on'] else False
print (f'argv = {sys.argv} limit: {limit} same_file {same_file}  stats {stats}')
# create the file encoded for the yaml
os.system('FNAME="write_lots.py" && cat "$FNAME" | python -m base64 > "$FNAME.b64"')
while(limit is None or lines< limit) : file_cnt += 1 filename= f'file' if same_file else f'bloat{file_cnt}' f = open(f'{filename}', "w") for x in range(1,1000*1000+1): f.write(f'{file_cnt}) {x}: write line {lines} ============================================> n');
     lines += 1
     if (lines%(1000*1000)==0):
        print(f'Written {file_cnt} {filename}) {x}: write line {lines}')
  f.close()
  print(f'{file_cnt}) close {filename} written {x} total {lines} ');
  if (stats):
     try:
        os.system('''ps auxww | grep -E "python [w]rite_lots|[P]ID " ''')
        os.system('free')
     except(e):
        pass
The python code has options to use the same file/stats and sizes as our original source code.
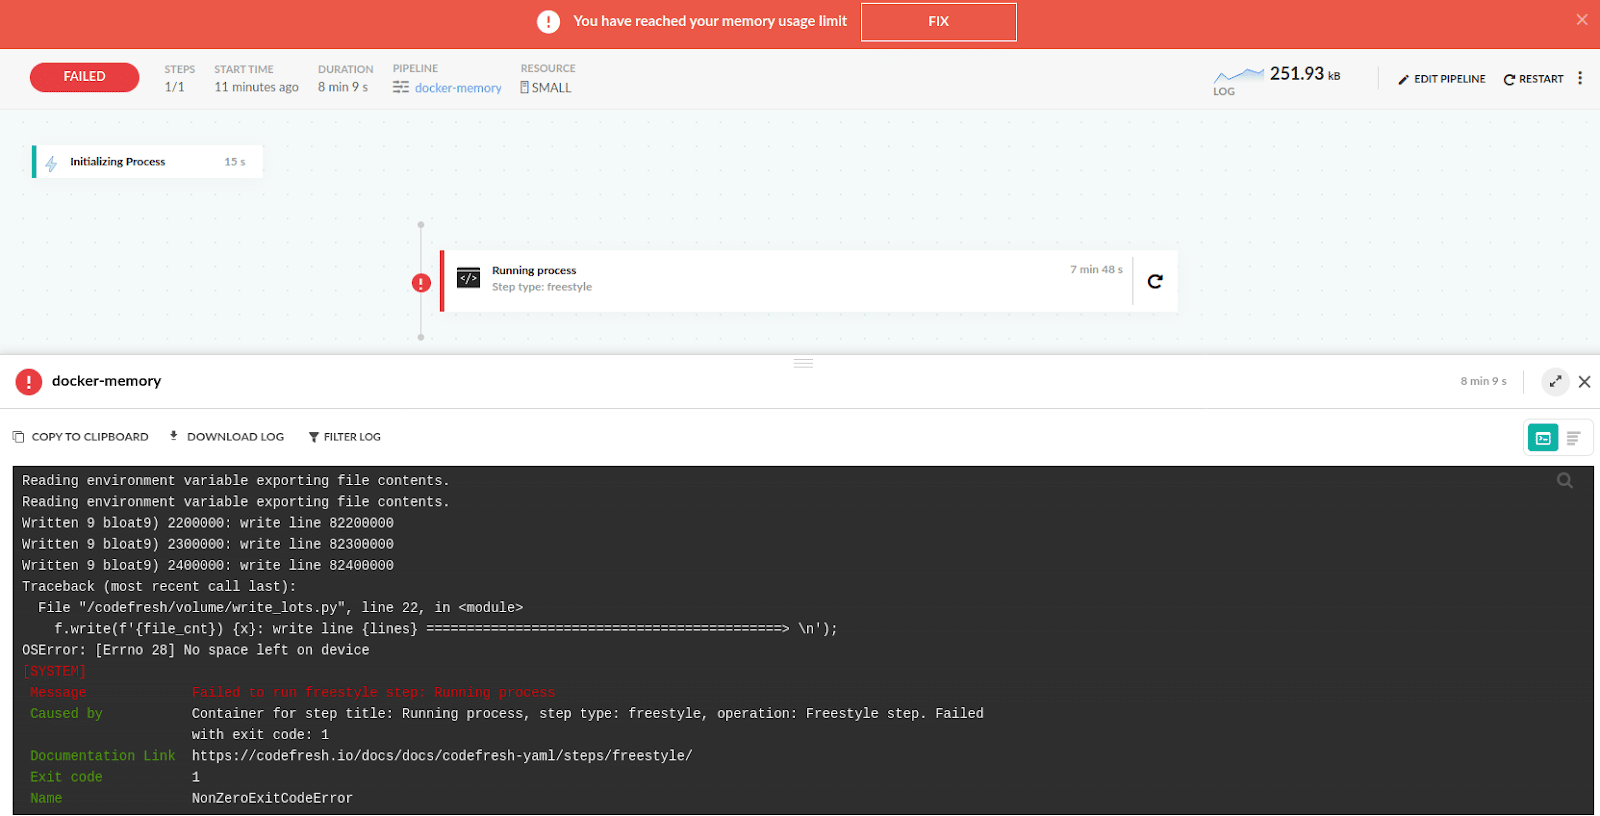
Reproducing in the Codefresh Platform
Instead of running the script separately, you can also use the following codefresh.yml file with the python code embedded. Note that the long string is the embedded Python code.
version: "1.0"
stages:  []
steps:
  run:
    title: "Running process"
    image: python
    commands:
            - ls
            - pwd
            - FNAME="write_lots.py"
            - echo ' content was created by bash> FNAME="write_lots.py" && cat "$FNAME" | python -m base64 > "$FNAME.b64" '
            - >-
                echo  "
                       aW1wb3J0IG9zCmltcG9ydCBzeXMKZnJvbSBjb2xsZWN0aW9ucyBpbXBvcnQgZGVmYXVsdGRpY3QK
                       bGluZXMgPSAwCmZpbGVfY250ID0gMApkPWRlZmF1bHRkaWN0KGxpc3QpCmZvciBrLCB2IGluICgo
                       ay5sc3RyaXAoJy0nKSwgdikgZm9yIGssdiBpbiAoYS5zcGxpdCgnPScpIGZvciBhIGluIHN5cy5h
                       cmd2WzE6XSkpOgogICAgICBkW2tdLmFwcGVuZCh2KQpwcmludCAoZCkKbGltaXQgPSBpbnQoZC5n
                       ZXQoJ2xpbWl0JylbMF0pIGlmICBkLmdldCgnbGltaXQnKSAgZWxzZSBOb25lCnNhbWVfZmlsZSA9
                       ICBGYWxzZSBpZiBub3QgZC5nZXQoJ2Jsb2F0Jykgb3IgZC5nZXQoJ2Jsb2F0JylbMF0gaW4gWyd0
                       cnVlJywgJ29uJ10gZWxzZSBUcnVlCnN0YXRzID0gIFRydWUgaWYgbm90IGQuZ2V0KCdzdGF0cycp
                       IG9yIGQuZ2V0KCdzdGF0cycpWzBdIGluIFsndHJ1ZScsICdvbiddIGVsc2UgRmFsc2UKZmlsZXNp
                       emUgPSAgaW50KGZsb2F0KGQuZ2V0KCdmaWxlc2l6ZScpWzBdKSoxMDAwMDAwMCkgaWYgZC5nZXQo
                       J2ZpbGVzaXplJykgZWxzZSAgMTAwMDAwMDAKcHJpbnQgKGYnYXJndiA9IHtzeXMuYXJndn0gbGlt
                       aXQ6IHtsaW1pdH0gc2FtZV9maWxlIHtzYW1lX2ZpbGV9ICBzdGF0cyB7c3RhdHN9IGZpbGVzaXpl
                       IHtmaWxlc2l6ZX0nKSAKIyBjcmVhdGUgdGhlIGZpbGUgZW5jb2RlZCBmb3IgdGhlIHlhbWwKb3Mu
                       c3lzdGVtKCdGTkFNRT0id3JpdGVfbG90cy5weSIgJiYgY2F0ICIkRk5BTUUiIHwgcHl0aG9uIC1t
                       IGJhc2U2NCA+ICIkRk5BTUUuYjY0IicpCndoaWxlKGxpbWl0IGlzIE5vbmUgb3IgbGluZXM8IGxp
                       bWl0KSA6CiAgIGZpbGVfY250ICs9IDEKICAgZmlsZW5hbWU9ICBmJ2ZpbGUnIGlmIHNhbWVfZmls
                       ZSBlbHNlIGYnYmxvYXR7ZmlsZV9jbnR9JyAKICAgZiA9IG9wZW4oZid7ZmlsZW5hbWV9JywgInci
                       KQogICBmb3IgeCBpbiByYW5nZSgxLGZpbGVzaXplKzEpOgogICAgICBmLndyaXRlKGYne2ZpbGVf
                       Y250fSkge3h9OiB3cml0ZSBsaW5lIHtsaW5lc30gPT09PT09PT09PT09PT09PT09PT09PT09PT09
                       PT09PT09PT09PT09PT09PT0+IFxuJyk7CiAgICAgIGxpbmVzICs9IDEKICAgICAgaWYgKGxpbmVz
                       JSgxMDAqMTAwMCk9PTApOgogICAgICAgICBwcmludChmJ1dyaXR0ZW4ge2ZpbGVfY250fSB7Zmls
                       ZW5hbWV9KSB7eH06IHdyaXRlIGxpbmUge2xpbmVzfScpCiAgIGYuY2xvc2UoKQogICBwcmludChm
                       J3tmaWxlX2NudH0pIGNsb3NlIHtmaWxlbmFtZX0gd3JpdHRlbiB7eH0gdG90YWwge2xpbmVzfSAn
                       KTsKICAgaWYgKHN0YXRzKToKICAgICAgdHJ5OgogICAgICAgICBvcy5zeXN0ZW0oJycncHMgYXV4
                       d3cgfCBncmVwIC1FICJweXRob24gW3ddcml0ZV9sb3RzfFtQXUlEICIgJycnKQogICAgICAgICBv
                       cy5zeXN0ZW0oJ2ZyZWUnKQogICAgICBleGNlcHQoZSk6CiAgICAgICAgIHBhc3MKCgoK
                " > "$FNAME.b64"
            - ls
            - cat "$FNAME.b64" | python -m base64 -d > "$FNAME"
            - ls -ltr
            - echo "the code"
            - cat "$FNAME"
            - date
            - echo "no bloat"
            - python "$FNAME" limit=400000000 bloat=off stats=on filesize=1
            - date
            - echo "would bloat"
            - python "$FNAME" limit=400000000 bloat=on stats=on filesize=1
            - echo done
            - date
To use this in your Codefresh pipeline, follow these steps.
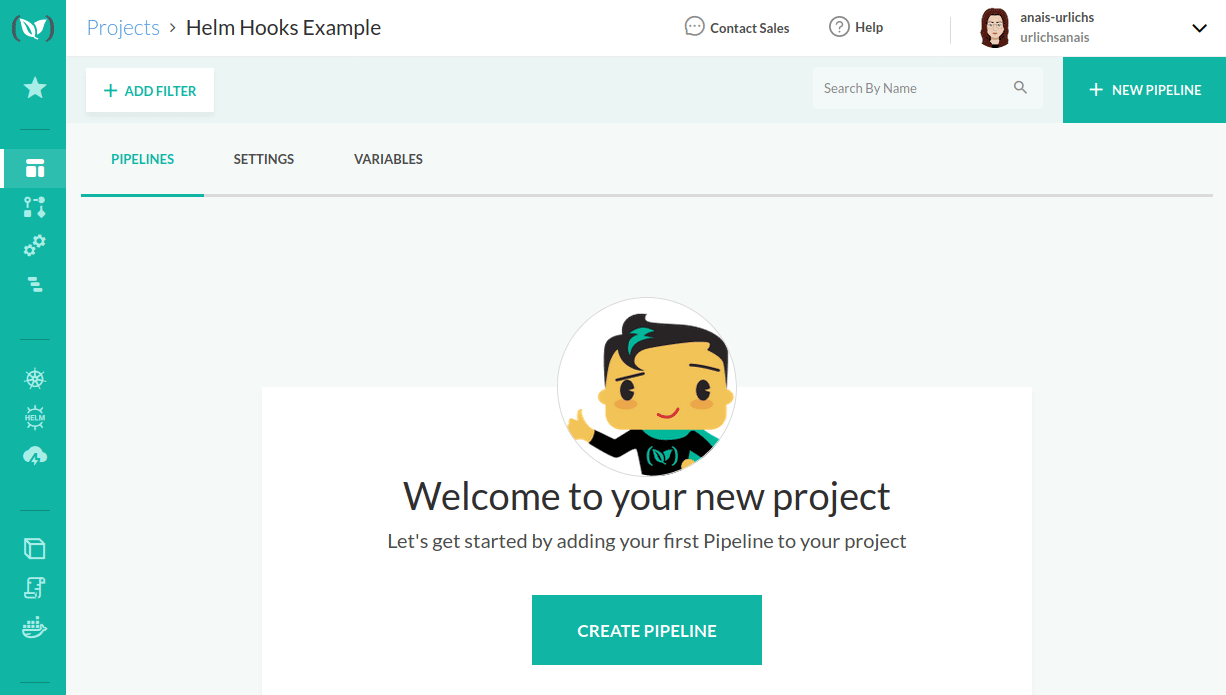
- First set-up your Codefresh account.

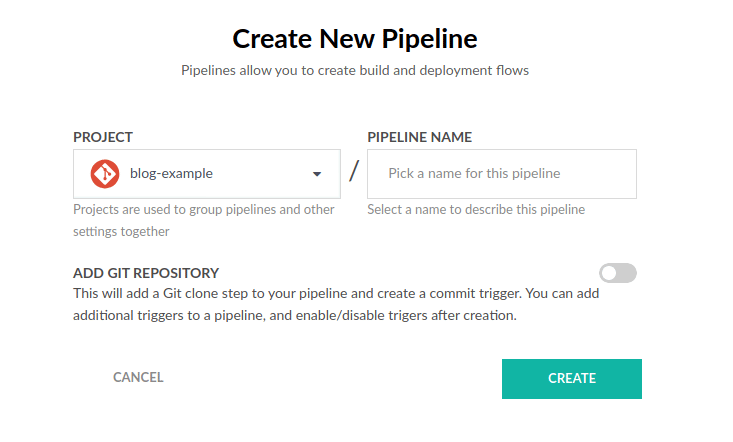
Create a new pipeline - Next, create a project and set-up a pipeline within the project.
- When you create the pipeline, make sure to turn the “add git example” off.

Create a new pipeline - It will provide a template codefresh.yml file by default. Replace this file with the YAML file above. This will show some warnings but should not throw any errors.

Paste the yaml into your pipeline - Next, run the pipeline.
- You can view the output in the Codefresh Console.
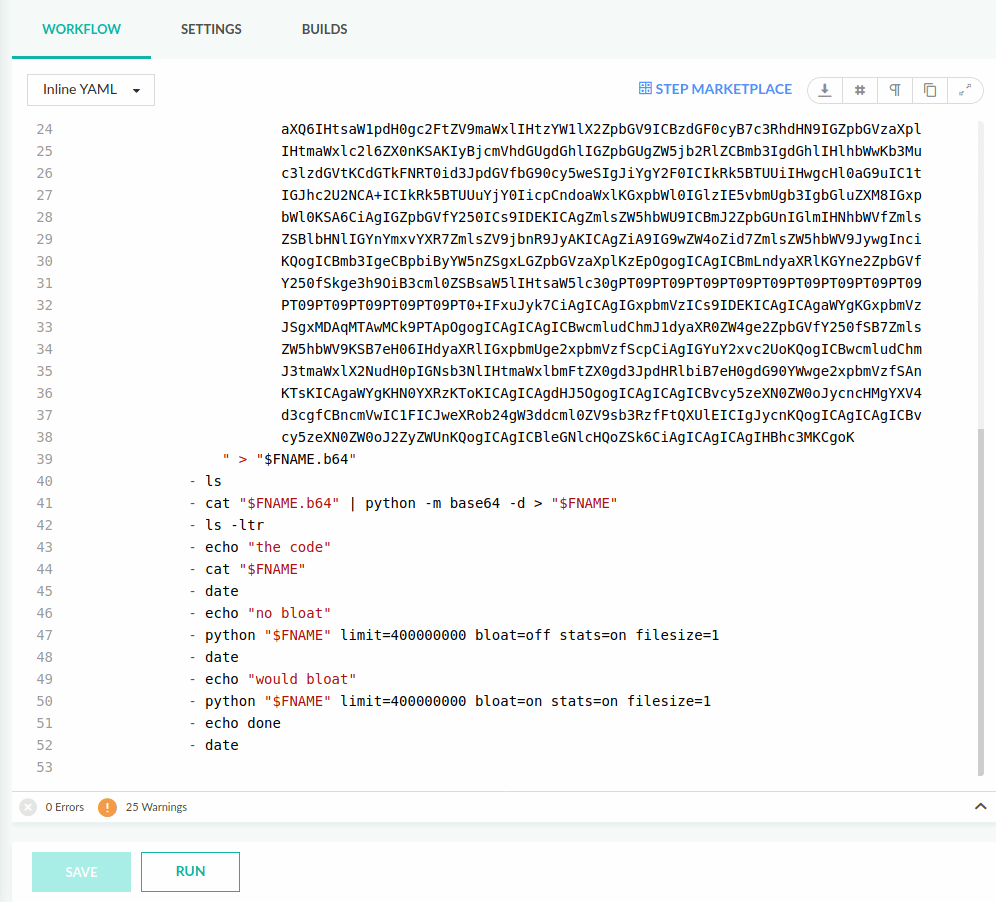
The pipeline runs the code twice. We have added a command-line option to our script (called bloat) which decides if we use a single file for output (our original design) or multiple files but with the same name (we will explain the choice in the next section).
The pipeline will still crash with an out of memory error.
Kubernetes analysis
Even though the problem seems to be Docker related, our initial analysis was started with Kubernetes (Codefresh is running pipeline inside Docker containers on a Kubernetes cluster).
To debug the issue we ran the following command in order to get a shell inside the container.
# NS=the namespace  NAME= the container name
kubectl -n $NS exec --stdin --tty $NAME -- /bin/bash
We looked at the buffer/cache by running the Linux free command. This showed growing memory usage:
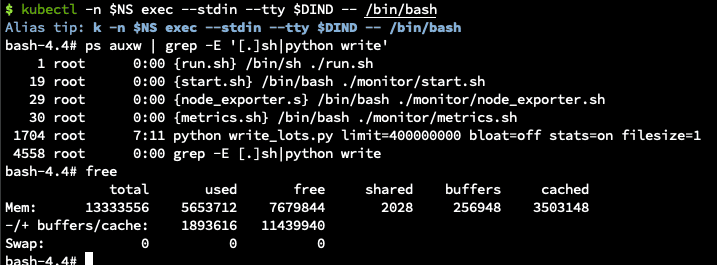
Next, we tried removing all the code and focused on the process of creating the file to see whether it is a problem with the code or the file generation and usage. In this case, the same thing happened and the memory still increased.
We cross-checked whether it was the code or creating the file by writing into /dev/null. Dev/null is a file that is present in every Linux OS, also known as the null device on UNIX systems, and sometimes called ‘the black hole’. It is only used to write, and whatever is written into dev/null will be immediately disregarded.
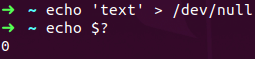
So the assumption is that writing into this file should not have any effect on the memory used.
However, using /dev/null did not change anything. The memory also bloated in this case. We now knew the issue is related to writing the file.
First approach: clearing the memory cache
Now that we know what the issue was, we had to find a solution or workaround.
The next step that most developers would take is searching online for answers (i.e. the stack overflow approach). Thus, we looked for combined issues with the buff/cached and the free command.
This gave us the following search results:
- “buff/cache – The combined memory used by the kernel buffers and page cache and slabs. This memory can be reclaimed at any time if needed by the applications.”
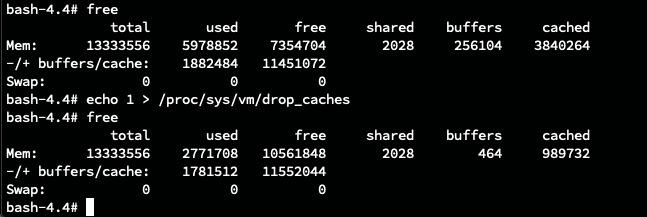
These commands force/trigger to clear the cache, which should usually clear automatically when the need arises. To try this out, either of the following commands would work:
- one way: echo 1 > /proc/sys/vm/drop_caches
- Another, less hacky: sysctl -w vm.drop_caches=1
The screenshot below shows the size of the cache before and after.
Next, we used a one-liner script in the shell to keep the process alive and the cache low:
- while sleep 60; do sysctl -w vm.drop_caches=1 ; echo .; done
When we were calling the script in the shell on the running container, the process did finish like expected. However, while running the script in combination with our own process, it still failed. In this case, we used the following command:
sysctl -w vm.drop_caches=1
=> sysctl: setting key "vm.drop_caches": Read-only file system
Note that our Kubernetes cluster used spot instances. Thus, there might be other reasons for the crash than memory bloat. The best practice, especially when using spot instances, is to build the process as incremental work. If the process fails, restarting it will not make it work the second time around. In this case, the work would have to be down-scaled again.
If you are interested in the topic, you can find several suggestions online related to increasing proc/sys/vm/vfs_cache_pressure.
Second approach: Using Multiple Files instead of one
Remember how we mentioned above that the file we wanted to transfer had over 20 million lines of data? Our second thought was that something along executing the file could have messed with our process, or that the file was simply too large. A colleague suggested writing many files instead of executing a single big one. Thus we divided the content across multiple files. At first, we used the following naming pattern: job1.json, job2.json…
It turned out, using multiple files was a lot better in various ways. Each file would run in sequential order. This allowed us to see the progress of the job and play with partial data.
But unfortunately, the process still failed in the end and we were back to square one.
Third approach: Using a single file multiple times
Our last approach was simply using the same filename “job” for each batch of work instead of naming every file differently.
In this case, the kernel clears the cached filesystem buffer nodes when the file is deleted/truncated.
Finally, this solved the issue and our ETL application finished successfully! Hurray!
One way to avoid writing large amounts of data to the file system is to write the data to a different destination like an external bucket service which is not cached by the Linux file system.
Final Thoughts
When we started the experiments, we expected to see deterministic behavior. We expected the process to run as defined in the source code and produce the same output every time.
What we saw instead was a different behavior every time we ran the script.
Running our script always produced a different result depending on cluster type, memory allocation, and timing. This made our process quite unpredictable and added difficulty in determining the issues. Every time we would change one of the variables before running the code, the outcome would be different. It could result in a crash, the memory limit was reached, a slow down of our CPU, or we would receive an OSError: [Errno 28] No space left on device.
Overall, there is a lot more going on behind the Docker infrastructure abstraction which our script does not reveal.
While we did not find a definite cause of the problem, we found a workaround. Here are the main takeaways:
- When using Docker, don’t write large amounts of data into your filesystem. Instead, write it directly into external services.
- If you still have to store data at an intermediate location, use a limited memory space and overwrite/delete the data once it is no longer needed. By flushing the buffer/cache we can avoid a memory bloat.
- Do not reuse the same file to record an extensive amount of data.
- Lastly, you should understand the implications of using spot instances for your Kubernetes cluster.
Please let us know in the comments whether this story was interesting to you and whether you would like to read more of this type. Also, please share with us any questions or suggestions for us and for the community.
If you are new to Codefresh Create Your Free Account today and try out the memory bloat!